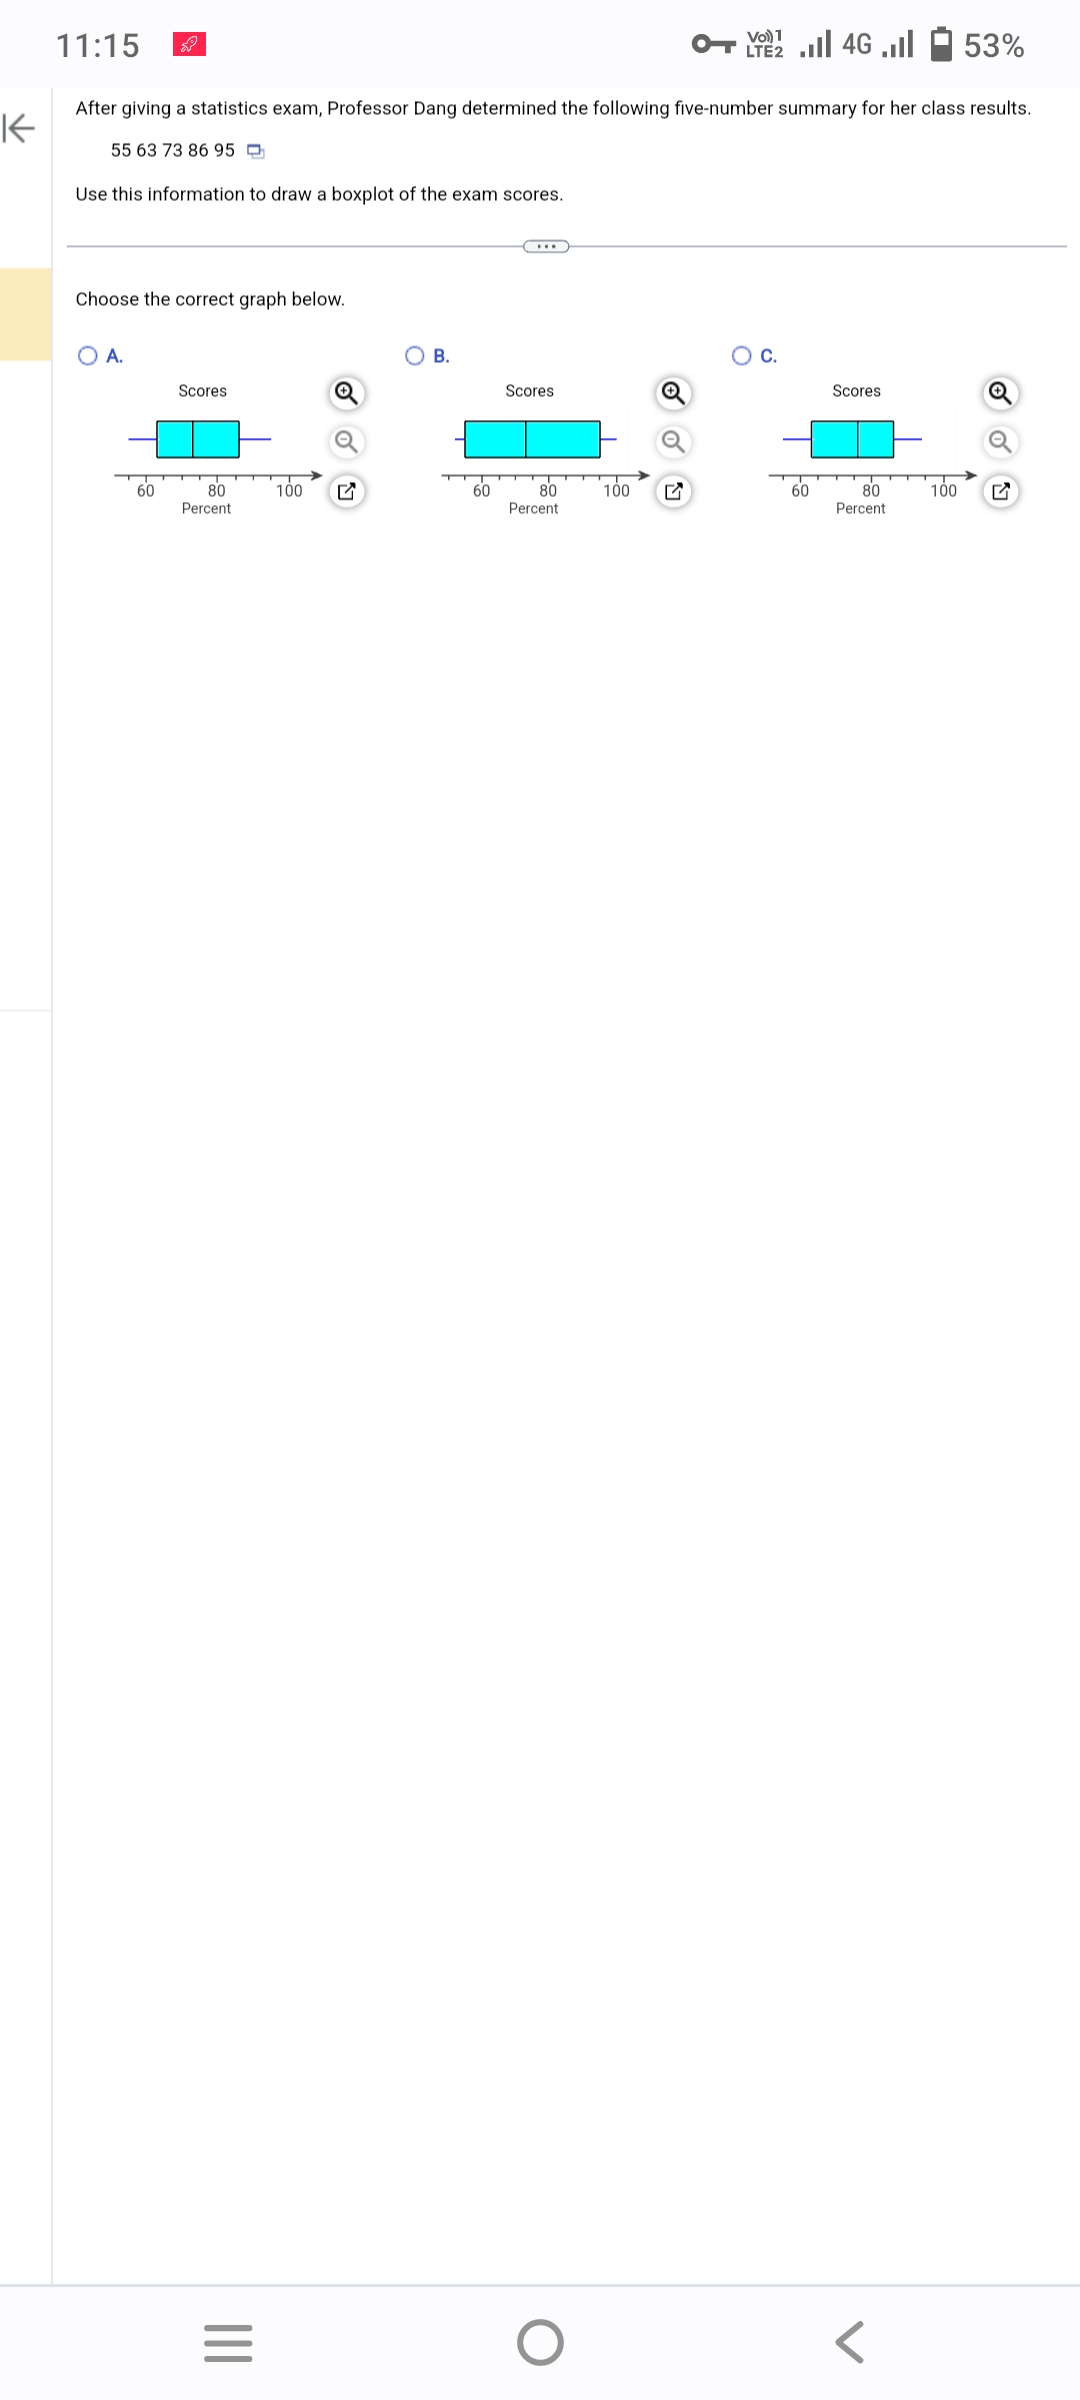
After giving a statistics exam, Professor Dang determined the following five-number summary for her class results. 55 63 73 86 95 Use this information to draw a boxplot of the exam scores. Choose the correct graph below. O A. 60 Scores 80 Percent 100 B. 60 Scores 80 Percent 100 Q Q O C. 60 Scores 80 Percent 100


Q: Suppose you took a sample of n=20 observations, and your sample was: {56, 58, 50, 51, 65, 74, 71,…
A: import numpy as np sample = np.array([56, 58, 50, 51, 65, 74, 71, 77, 76, 88, 95, 93, 100, 93, 91,…
Q: Youth admissions to correctional services, by age and sex 2019-2020 Age at admission 12 year old 13…
A: The age of admission is independent variable (x) and number is dependent variable (y) we represent…
Q: A poll was conducted to investigate opinions about global warming. The respondents who answered yes…
A: It is needed to check the claim that whether the sex of the respondent is independent of the choice…
Q: K- A poll was conducted to investigate opinions about global warming. The respondents who answered…
A: It is needed to test the claim that whether the sex of the respondent is independent of the choice…
Q: A group of students were asked if they carry a credit card. The responses are listed in the table.…
A: From the provided information, Class Credit Card Carrier Not a credit card carrier Total…
Q: Youth admissions to correctional services, by age and sex 2019-2020 Age at admission 12 year old 13…
A: Given data: Age (x) number of admissions (y) 12 6 13 62 14 194 15 343 16 492 17 548…
Q: The director of surgery at a local hospital is interested in understanding his unit’s costs. An…
A: Introduction: The partial regression analysis output is given for predicting the surgical unit cost,…
Q: Let X₁, X₂, X3,..., X, be a random sample of size n from population X. Suppose that X-N (0,1) and Y…
A: From the given information, Standard score for X¯ is, z=X¯-μσn=X¯-θ1n. Consider, Here, the…
Q: Select all that apply Which of the following are detection methods for multicollinearity, as…
A: Multicollinearity: If the independent variables in a multiple regression is correlated, then it…
Q: a) Suppose that Y₁, Y2,..., Y₁ is a random sample from a normal distribution with parameter mean 0…
A:
Q: The probability of a sunny day in Vancouver is. You listen to 4 independent weather forecasts, each…
A: From the given information, The probability of a sunny day in Vancouver is 1/3. P(sunny)=1/3 P(not…
Q: The following table establishes the discrete probability distribution of a person working a certain…
A: Given data is Days 20 21 22 23 24 25 26 Probability 0.01 a 0.1 0.15 b 0.23 0.26
Q: An academic Professor conducted a research aimed at exploring the experience and challenges faced by…
A: From the information, the claim is that the mean age of all people diagnosis with initial occurrence…
Q: The file High Desert Banking contains information regarding consumer, real estate, and small…
A: Given the file High Desert Banking contains information regarding consumer, real estate, and small…
Q: ncreased sales during the Christmas season is known as a. secular b. seasonal trend c. Cyclical…
A: If any sales be in a 2 or 3 month interval then we know it is a seasonal.
Q: 2. We have 2 types of binary sources. Each source outputs one bit, i.e. 'O' or '1', independently at…
A: Given that there are 2 types of binary sources. Each source outputs one bit, 0 or 1, independently…
Q: The concentration of carbon dioxide (COy) in the atmosphere is increasing rapidly due to our use of…
A: Given information: Pair Control Plot Treated plot Treated plot-Control Plot 1 9.752 10.587…
Q: Under the normal curve, approximately what percent of scores fall between -2 to -3 standard…
A: The mean and standard deviation of the standard normal distribution are 0 and 1, respectively.
Q: A survey by the National Retail Federation found that women spend on average R146.21 on a Saturday…
A: 1) GivenMean(μ)=146.21standard deviation(σ)=29.44
Q: Of those mountain climbers who attempt Mt. Everest, 68.2% reach the summit. In a random sample of 25…
A: Given that: Sample size, n=25 Probability of success, p=0.682
Q: Let X₁, X₂, X3, X, denote a random sample of size n from the population distributed with the…
A: Parameter space means the set of all possible values taken by the the parameter.
Q: about 27% per year since then. Predict when annual et
A: Given, A company's annual production of ethanol, used as fuel for automobiles, was 7.7 million…
Q: Let X₁, X₂, X3,..., Xn be a random sample of size n from population X. Suppose that X~N(0, 1) Σ1Xi…
A: From the given information, Moment of generating function of normal distribution is eμt+σ22t2. For…
Q: A manufacturer knows that their items have a normally distributed lifespan, with a mean of 14.7…
A:
Q: The National Association Against Child Violence will hold its annual fundraising campaign with a…
A: Given data is Collection 100 150 200 250 300 Probability 0.12 0.24 0.39 0.14 0.11
Q: A survey was conducted that asked (1004 people how many books they had read in the past year.…
A:
Q: A sports writer wants to see if a football filled with helium travels farther, on average, than a…
A: Obtain the 80% confidence interval for the mean difference in yardage for the two types of…
Q: Many investors and financial analysts believe the Dow Jones Industrial Average (DJIA) gives a good…
A: Givensample size(n)=64x=12significance level(α)=0.02sample proportion(p^)=xn=1264=0.1875
Q: We want to know if the average rating of attractiveness (1=homely, 5=stunning) of a typical person…
A: Since you have posted a question with multiple subparts, we will solve first three subparts for you.…
Q: The data below shows car model and the color of vehicles sold at a Car dealership. Hyundai 20 Honda…
A: Since you have posted a question with multiple sub-parts, we will solve first three sub- parts for…
Q: i) Show that the standard score of the sample mean X, is equal to Y. ii) Show that the mean and…
A: It is given that X follows N(θ, 1), then E(X) = θ and V(X) = 1, And the moment genarating function…
Q: Let X₁, X₂, X3,..., X be a random sample of size n from population X. Suppose that X~N(0,1) and Y =…
A: It is given that X follows N(θ, 1), then E(X) = θ and V(X) = 1, And the moment genarating function…
Q: State the least squares criterion,
A: Answer- By minimising the sum of squares produced by a mathmatical function, the least square…
Q: You intend to conduct an ANOVA with 102 subjects, which will be divided into 7 treatment groups.…
A:
Q: The following are the number of employees of 20 supermarkets:…
A: arrange data in accending order 35,45,55,55,56,56,60,65,67,69,70,71,75,76,88,89,89,90,90,103 here…
Q: ) State the null hypothesis Ho and the alternative hypothesis Ha.
A: It is given that p = proportion of defective products in the population. Test is that whether the p…
Q: . a sample from a Normal population with mean u = 20 and standard deviation o = 2.5 failed to reject…
A: Since you asked multiple questions, we will solve the first question for you. If you want any…
Q: A South African manufacturer of BMW cars offers a model in one of three colors: Blue, Red, or Black.…
A: Given information: There are 3 colors: Blue, Red and Black. P(Blue)=1/3 Claim: Test whether or not…
Q: The following volume distribution was derived from a sieve analysis (a) Estimate the arithmetic mean…
A:
Q: Find the equation of the regression line. ŷ=+ (Round the y-intercept to one decimal place as needed.…
A: Let Best Actress = X and Best Actor =Y
Q: 5. In a survey, 8236 out of 9858 doctors recommend aspirin for for their patients with headaches.…
A: Given,n=9858x=8236sample proportion(p^)=xnsample…
Q: Let X1, X2, X3, Xn denote a random sample of size n from the population distributed with the…
A:
Q: a) Suppose that Y₁, Y₂, ..., Y is a random sample from a normal distribution with parameter mean 0…
A:
Q: The following are the number of employees of 20 supermarkets:…
A: Given the data of number of employees of supermarkets;…
Q: Let X₁, X2, X3,..., Xn denote a random sample of size n from the population distributed with the…
A:
Q: Suppose that the number of new cases of a medical condition observed each week can be modelled using…
A: Let the random variable X denotes the number of new cases of a medical condition observed each week.…
Q: a) Let 3,1,3,0,3,2,2,0, 1, 2 be ten independent observations from a binomial experiment of four…
A: X~Bin(n=4, β) Sample size=10
Q: What is the MLE of g(0) ==¹? 1+0
A: It is given that the probability density function of X is f(x; θ) = { ( θ + 1 )•xθ, 0 < x <…
Q: Percent 20 15 10 5 0 2000 Figure 1 Charges English (United States) 10000 18000 Distribution of…
A: An outlier is an observation that lies outside of all the data points pattern.
Q: Travel + Leisure magazine provides an annual list of the 500 best hotels in the world. The magazine…
A: Let X be a random variable denoting the hotel size that is, the number of rooms and Y denoting the…


Trending now
This is a popular solution!

Step by step
Solved in 2 steps with 1 images

- The Internet The NAEP report described in Exercise 39compared science scores for students who had homeInternet access to the scores of those who did not, asshown in the graph. They report that the differences arestatistically significant.a) Explain what “statistically significant” means in thiscontext.b) If their conclusion is incorrect, which type of error didthe researchers commit? c) Does this prove that using the Internet at home can im-prove a student’s performance in science?The World Bank collects information on the fertility rate (children per woman) in the country and the life expectancy of a person (in years) in each country ('Life expectancy at,' 2013 and 'Fertility rate,' 2013). The data for 23 randomly selected countries for the year 2011 are in the table below. a) Since data were collected for variable(s), the correct graph to make is a .b) Make a scatterplot of X versus Y using technology. Use this graph to answer the part below. c) Which of the following is true about the relation between fertility rate and average life expectancy based on the graph above?Rita is a runner. She records the amounts of time that it takes her to run different distances in the scatter plot below. Which statements are true? a) There is a least one outlier represented in the scatter plot. b) There is a linear association between distance and time in the scatter plot. c) There is a nonlinear association between distance and time in the scatter plot. d) There is a positive association between distance and time in the scatter plot. e) There is a negative association between dstance and time in the scatter plot.
- HR manager in L&B real-state company is working with finance department in improving thesalaries and the following descriptive statistics were obtained ( The table attached ) ( The graph attached ) ------------ The company has hired you to answer the following questions:1) Find the missing values of (a), (b), (c) and (d). 2) Do you think that the salaries in the departments are skewed, justify your answer with proper measurefrom table (2).3) Based on the boxplot for the salaries by department in graph (1), comment on the graph in terms ofexistence of outliers, skewness and which department has higher outliers.4) Based on your answer in (3), comment and compare on the suitable central and absolute dispersionmeasures depending on table (2).5) Based on table (1), do you think the salaries of which group is more homogenous, support your answerand comment on the results.1, on the survey, the question "what is your favorite season: winter, spring, summer, fall?" appears. a) what type of data (continuous, discrete, categorical) is being collected?. explain. b) what type of graph would be best to represent this information? explain.The coaches of a group of debate teams answered a survey about hours of debate and number of team wins. The graph shows the result of the survey. Based on these results if a team practices 6 hours per week next season, which is the best estimate of the number of debates the team can expect to win? 1 24 2 20
- 6. The table below shows last semester’s cumulative scores for the seven students sitting closest to the front in lecture and the seven students sitting furthest back in lecture. Determine how this data could be best represented graphically and construct a graph. Should you use a line or bar graph? Use the example graphs provided to ensure you have a “complete” graph. Table 2. Final cumulative scores for students sitting closest to the front and furthest back in Biology 10 lecture. Seating Location Student Scores Front of class Gary 76 Veronica 97 Rodrigo 94 Ying 87 Mohammad 84 Kayla 71 Saundra 68 Back of class Heidi 62 Duy 70 David 74 Joey 65 Lisa 73 Hei 64 Jose 82Q6A The World Bank collected data on the percentage of GDP that a country spends on health expenditures ("Health expenditure," 2013) and also the percentage of women receiving prenatal care ("Pregnant woman receiving," 2013). The data for 14 countries where this information is available for the year 2011 are in following table (note: outlier data has been removed): Data of Health Expenditure versus Prenatal Care Health Expenditure (% of GDP) Prenatal Care (%) 3.7 54.6 5.2 93.7 5.2 84.7 10.0 100.0 4.7 42.5 4.8 96.4 6.0 77.1 5.4 58.3 4.8 95.4 4.1 78.0 6.0 93.3 9.5 93.3 6.8 93.7 6.1 89.8 Test at the 5% level for a correlation between percentage spent on health expenditure and the percentage of women receiving prenatal care. (i) Which of the following statements correctly define both the null hypothesis HOand the alternative hypothesis HA ? A. HO : ρ = 0 HA : ρ < 0 B. HO :…Q6.2 The World Bank collected data on the percentage of GDP that a country spends on health expenditures ("Health expenditure," 2013) and also the percentage of women receiving prenatal care ("Pregnant woman receiving," 2013). The data for 14 countries where this information is available for the year 2011 are in following table (note: outlier data has been removed): Data of Health Expenditure versus Prenatal Care Health Expenditure (% of GDP) Prenatal Care (%) 3.7 54.6 5.2 93.7 5.2 84.7 10.0 100.0 4.7 42.5 4.8 96.4 6.0 77.1 5.4 58.3 4.8 95.4 4.1 78.0 6.0 93.3 9.5 93.3 6.8 93.7 6.1 89.8 Test at the 5% level for a correlation between percentage spent on health expenditure and the percentage of women receiving prenatal care. (iv) Calculate and enter test statistic Enter value in decimal form rounded to nearest hundredth, with appropriate sign (no spaces). Examples of correctly…
- Number of cards 0 1 2 or 3 4 or more Number of people 66 54 42 41 Construct a pie graph for the given data10. The mosaic plot shows the distribution of favorite math class for students and teachers at East Kentwood High School. Based on the graph, which of the following statements is true? (A) There are more teachers than students who chose their favorite math class as AP Calc. (B) 100% of students chose Intro Stats as their favorite math class. (C) When combining students and teachers, AP Stats has the highest overall proportion who chose it as their favorite math class. (D) 80% of students chose AP Calc. (E) There are more teachers than students at East Kentwood High School.Scenario: A pediatrician wants to determine the relation that may exist between a child’s height and head circumference. She randomly selects eleven 3-year old children from her practice, measures their heights and head circumference, and obtains the data shown below: Child’s Height and Head Circumference Height (inches) Head Circumference (inches) 27.75 17.6 24.5 17.3 25.5 17.4 26 17.5 25 17.1 25.75 17.8 26.5 17.5 27 17.7 26.75 17.5 26.75 17.8 27.5 17.7 If the pediatrician wants to use height to predict head circumference, determine which variable is the explanatory variable and which is response variable. Draw a scatter diagram of the data. Draw the best fit line on the scatter diagram. Does this scatter diagram show a positive, negative, or no relationship between a child’s height and the head circumference?
