Again, without performing any calculations, what would be less likely to occur: Obtaining a sample proportion of 0.60 or larger when randomly selecting a sample of size n = 25, or obtaining a sample proportion of 0.60 or larger when randomly selecting a sample of size n = 50? Please
Again, without performing any calculations, what would be less likely to occur: Obtaining a sample proportion of 0.60 or larger when randomly selecting a sample of size n = 25, or obtaining a sample proportion of 0.60 or larger when randomly selecting a sample of size n = 50? Please

College Algebra (MindTap Course List)
12th Edition
ISBN:9781305652231
Author:R. David Gustafson, Jeff Hughes
Publisher:R. David Gustafson, Jeff Hughes
Chapter8: Sequences, Series, And Probability
Section8.7: Probability
Problem 58E: What is meant by the sample space of an experiment?

Related questions

Question
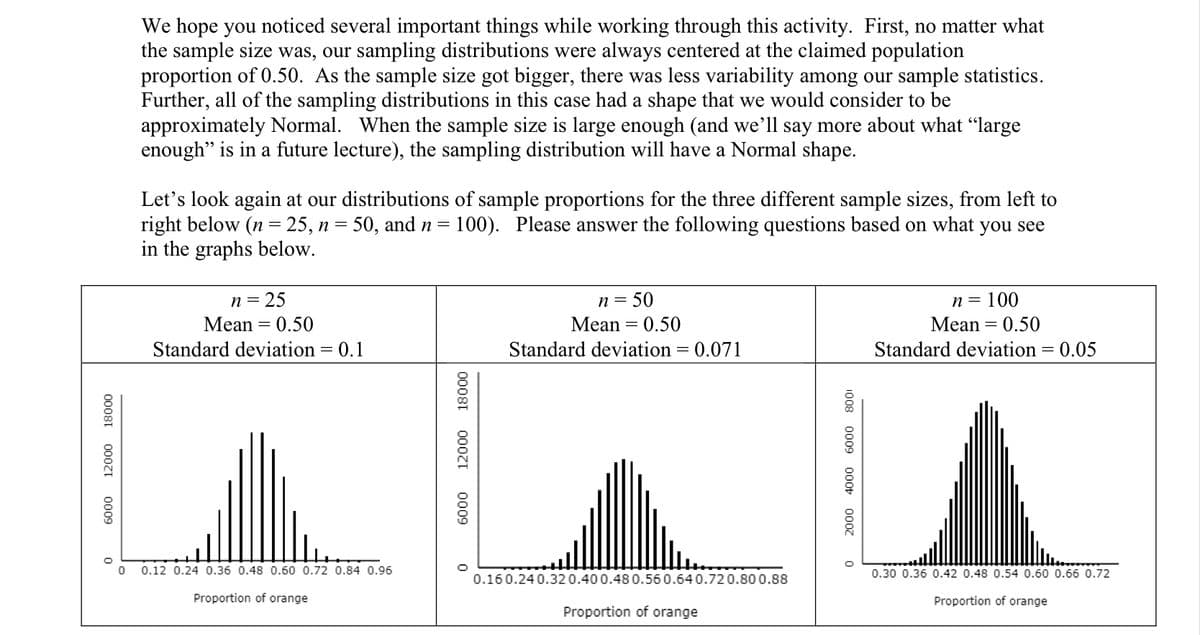
Transcribed Image Text:We hope you noticed several important things while working through this activity. First, no matter what
the sample size was, our sampling distributions were always centered at the claimed population
proportion of 0.50. As the sample size got bigger, there was less variability among our sample statistics.
Further, all of the sampling distributions in this case had a shape that we would consider to be
approximately Normal. When the sample size is large enough (and we'll say more about what "large
enough" is in a future lecture), the sampling distribution will have a Normal shape.
Let's look again at our distributions of sample proportions for the three different sample sizes, from left to
right below (n = 25, n = 50, and n = 100). Please answer the following questions based on what you see
in the graphs below.
n = 25
Mean = 0.50
n= 50
Mean = 0.50
n = 100
Mean = 0.50
Standard deviation = 0.1
Standard deviation:
0.071
Standard deviation = 0.05
0.12 0.24 0.36 0.48 0.60 0.72 0.84 0.96
0.30 0.36 0.42 0.48 0.54 0.60 0.66 0.72
0.160.24 0.32 0.400.48 0.560.64 0.720.800.88
Proportion of orange
Proportion of orange
Proportion of orange
2000 4000 6000 8001
00081
00071
0009
0009
12000 18000

Transcribed Image Text:Again, without performing any calculations,' what would be less likely to occur: Obtaining a
sample proportion of 0.60 or larger when randomly selecting a sample of size n = 25, or obtaining
a sample proportion of 0.60 or larger when randomly selecting a sample of size n =
50?
Please
explain
Expert Solution
This question has been solved!
Explore an expertly crafted, step-by-step solution for a thorough understanding of key concepts.

This is a popular solution!

Trending now
This is a popular solution!

Step by step
Solved in 2 steps

Knowledge Booster


Learn more about
Need a deep-dive on the concept behind this application? Look no further. Learn more about this topic, statistics and related others by exploring similar questions and additional content below.Recommended textbooks for you
College Algebra (MindTap Course List)
Algebra
ISBN:
9781305652231
Author:
R. David Gustafson, Jeff Hughes
Publisher:
Cengage Learning
College Algebra (MindTap Course List)
Algebra
ISBN:
9781305652231
Author:
R. David Gustafson, Jeff Hughes
Publisher:
Cengage Learning