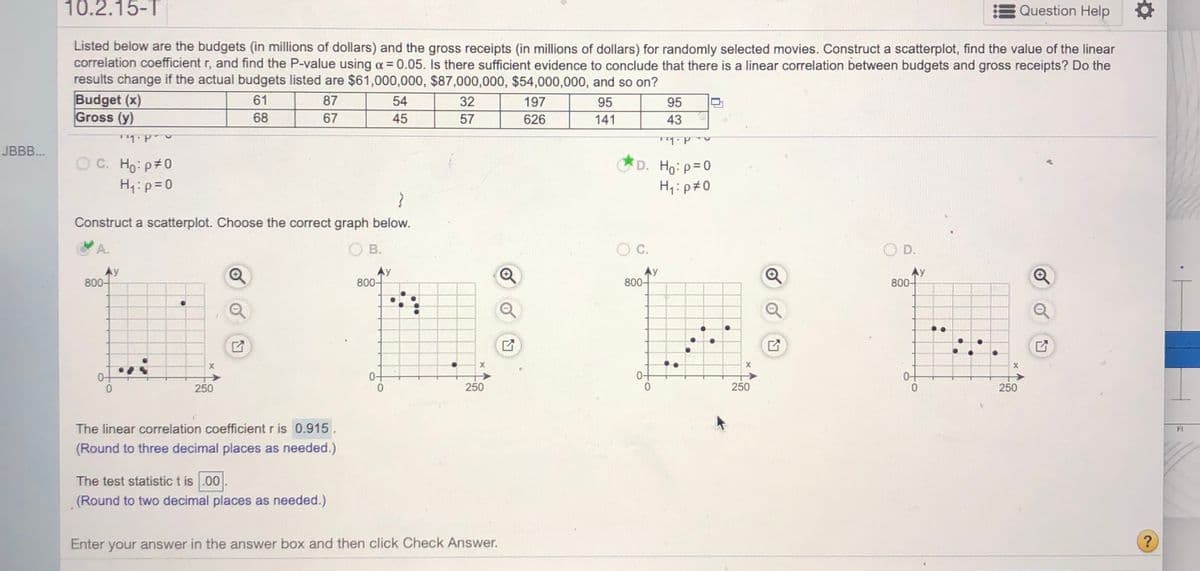
Listed below are the budgets (in millions of dollars) and the gross receipts (in millions of dollars) for randomly selected movies. Construct a scatterplot, find the value of the linear correlation coefficient r, and find the P-value using a = 0.05. Is there sufficient evidence to conclude that there is a linear correlation between budgets and gross receipts? Do the results change if the actual budgets listed are $61,000,000, $87,000,000, $54,000,000, and so on? Budget (x) Gross (y) 61 87 54 32 197 95 95 68 67 45 57 626 141 43 *D. Ho: p=0 O C. Ho: p#0 H,:p=0 H,: p#0 Construct a scatterplot. Choose the correct graph below. O B. OC. O D. 800- AY 800- 800- Ay 800- 0- 250 250 250 The linear correlation coefficient r is 0.915. (Round to three decimal places as needed.) The test statistic t is .00 (Round to two decimal places as needed.)


Correlation
Correlation defines a relationship between two independent variables. It tells the degree to which variables move in relation to each other. When two sets of data are related to each other, there is a correlation between them.
Linear Correlation
A correlation is used to determine the relationships between numerical and categorical variables. In other words, it is an indicator of how things are connected to one another. The correlation analysis is the study of how variables are related.
Regression Analysis
Regression analysis is a statistical method in which it estimates the relationship between a dependent variable and one or more independent variable. In simple terms dependent variable is called as outcome variable and independent variable is called as predictors. Regression analysis is one of the methods to find the trends in data. The independent variable used in Regression analysis is named Predictor variable. It offers data of an associated dependent variable regarding a particular outcome.


Trending now
This is a popular solution!

Step by step
Solved in 3 steps with 1 images


