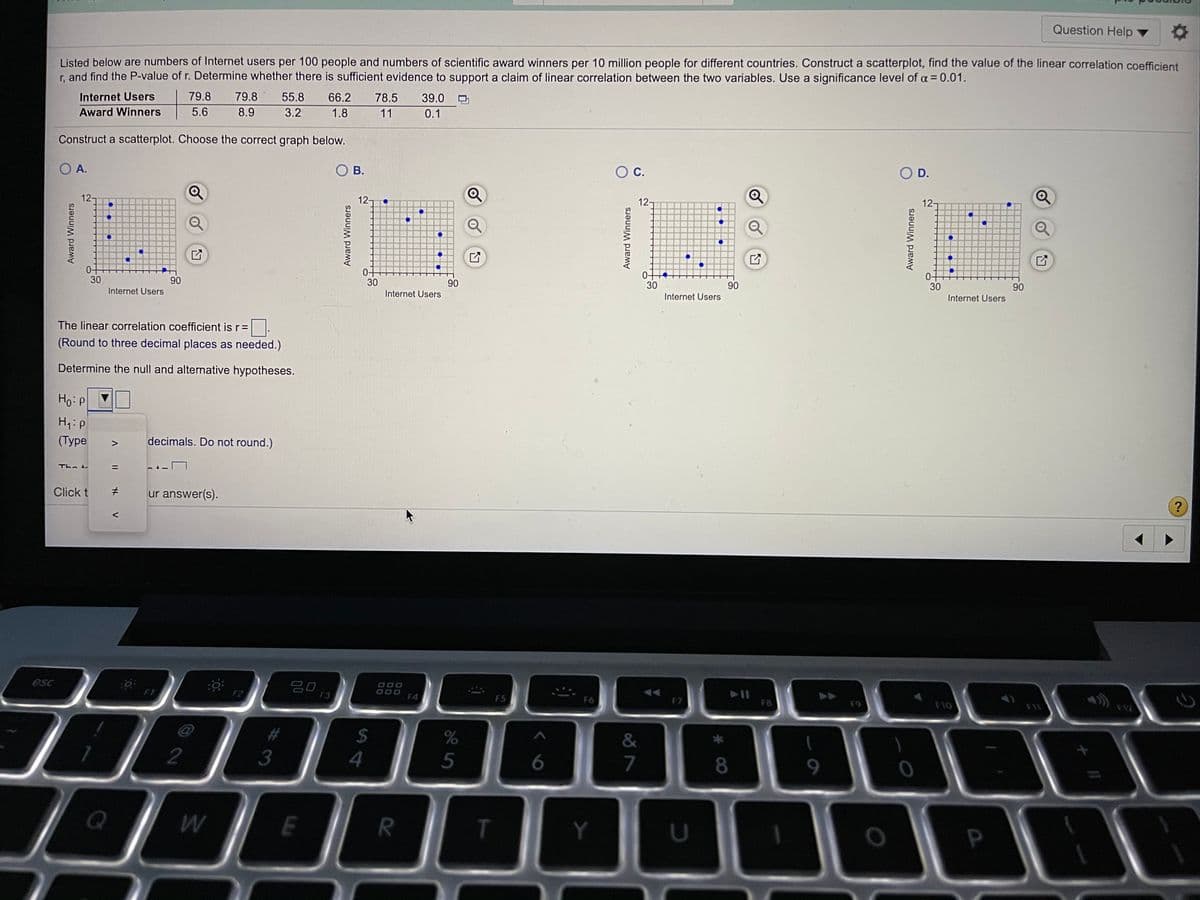
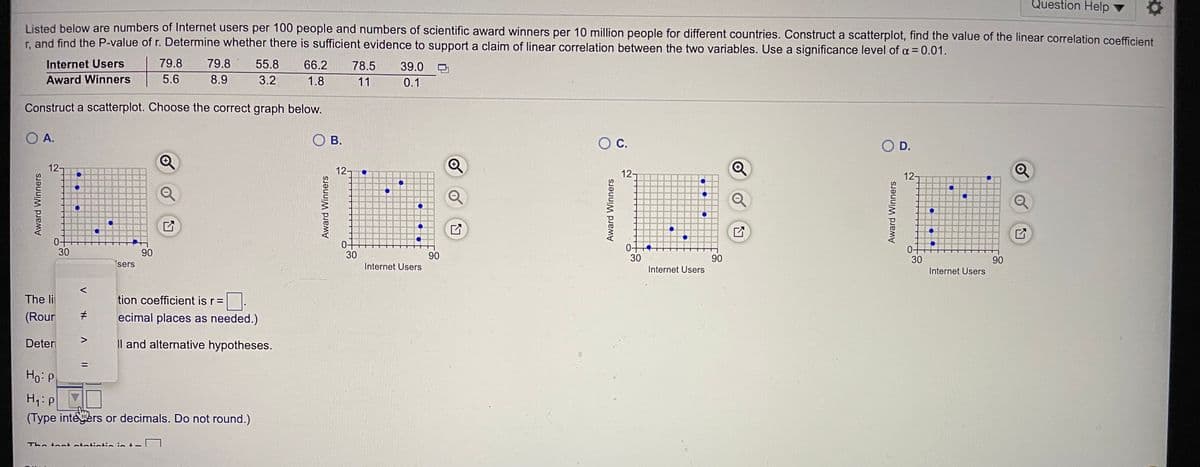
Listed below are numbers of Internet users per 100 people and numbers of scientific award winners per 10 million people for different countries. Construct a scatterplot, find the value of the linear correlation coefficient r, and find the P-value of r. Determine whether there is sufficient evidence to support a claim of linear correlation between the two variables. Use a significance level of a = 0.01. Internet Users 79.8 79.8 55.8 3.2 66.2 78.5 39.0 O 0.1 Award Winners 5.6 8.9 1.8 11 Construct a scatterplot. Choose the correct graph below. O A OB. Oc. OD. 12- 30 Internet Users Internet Users Internet Users Internet Users Award Winners ward Winners


Correlation
Correlation defines a relationship between two independent variables. It tells the degree to which variables move in relation to each other. When two sets of data are related to each other, there is a correlation between them.
Linear Correlation
A correlation is used to determine the relationships between numerical and categorical variables. In other words, it is an indicator of how things are connected to one another. The correlation analysis is the study of how variables are related.
Regression Analysis
Regression analysis is a statistical method in which it estimates the relationship between a dependent variable and one or more independent variable. In simple terms dependent variable is called as outcome variable and independent variable is called as predictors. Regression analysis is one of the methods to find the trends in data. The independent variable used in Regression analysis is named Predictor variable. It offers data of an associated dependent variable regarding a particular outcome.


Trending now
This is a popular solution!

Step by step
Solved in 4 steps with 2 images


