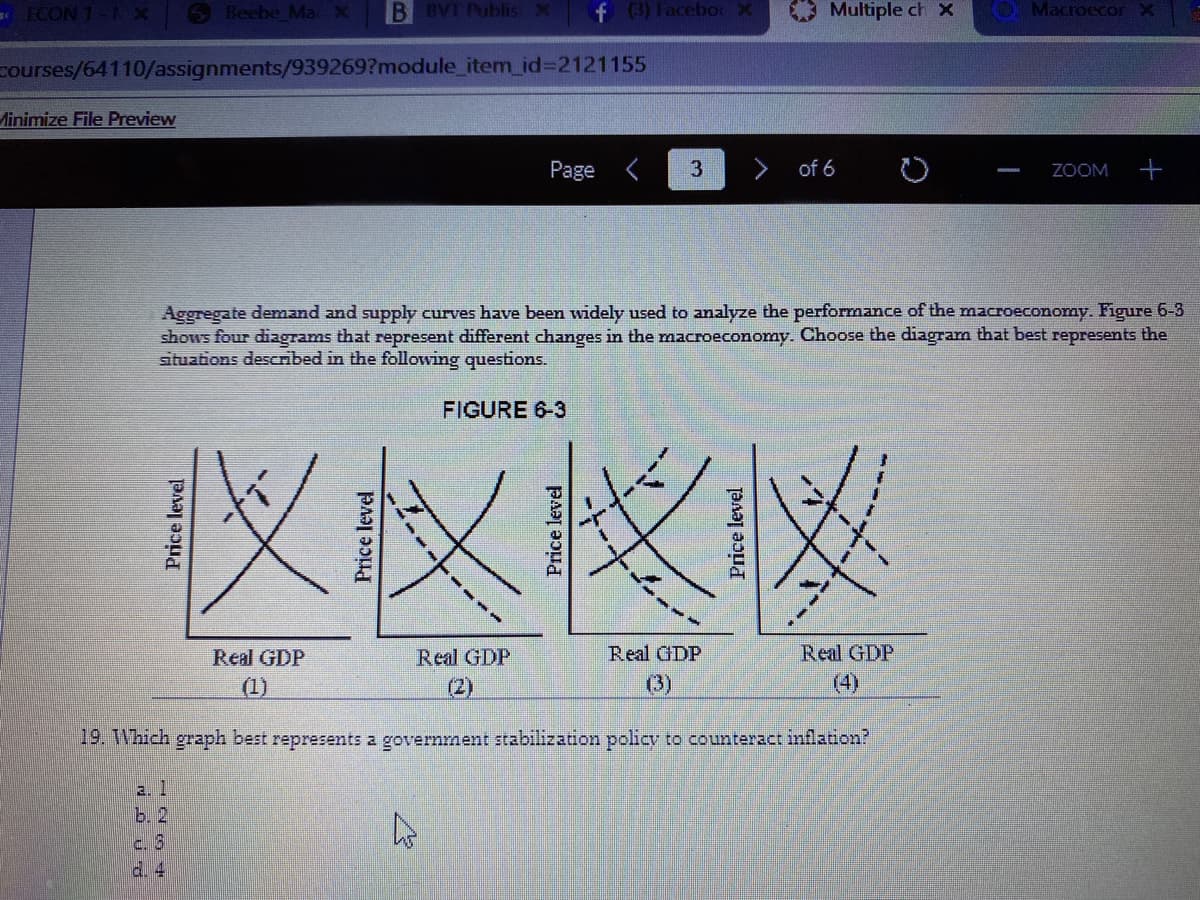
Aggregate demand and supply curves have been widely used to analyze the performance of the macroeconomy. Figure 6-3 shows four diagrams that represent different changes in the macroeconomy. Choose the diagram that best represents the situations described in the following questions. FIGURE 6-3 Real GDP Real GDP Real GDP Real GDP (1) (2) (3) (4) 19. 1Which graph best represents a government stabilization policy to counteract inflation? a. 1 b. 2 c. 3 a.4
Q: In country X, the unemployment rate is 13%, the inflation rate is 16% and the GDP growth rate is 3%.…
A: Handling unemployment, inflation and GDP growth rate is not possible with a single policy. It has to…
Q: In the graph of Figure I, the annual growth rate of the GDP of the United States economy is…
A: Consumption Function is defined as the function which portrays the relationship between the Real GDP…
Q: The three figures below show the phases of a disinflation. In part (i), the economy is experiencing…
A: The AD-AS model shows the interaction between total demand and total supply at the macroeconomic…
Q: The Keynesian AD-AS model describes what happens with price levels when aggregate demand increases.…
A: Ans. 1) Demand-pull inflation refers to an economic phenomenon in which an increase in the aggregate…
Q: Figure C Figure D P level 60 P level 60 ASo LRAS LRAS 50 50 ASo 40 40 30 30 20 20 AD1 10 10 ADo AD1H…
A: In an economy, Keynesian economics emphasizes on government intervention to influence market…
Q: n the graph of Figure I, the annual growth rate of the GDP of the United States economy is presented…
A: Figure 2: Graph 1: It can be seen that the aggregate demand curve shifts to the right in the graph…
Q: Assuming the economy has a strong-form market and that the current economy has reached its long-term…
A: We know that current situation of economy is at full employment level where AS = AD = LRAS But if…
Q: The economy of Moneyland has an actual unemployment rate that is less than the natural unemployment…
A: Since the question you have posted has multiple parts, we will solve the first-three parts for you.…
Q: Refer to the table below. (SEE PICTURE) Suppose that aggregate demand increases such that the…
A: Equilibrium refers to the point where the demand curve intersects with the supply curve, here the…
Q: 3. are economists who generally emphasize the importance of aggre supply in determining the size of…
A: Neoclassical theory suggests that a company's investment level needs to depend only on recognized…
Q: Plot an AD/AS diagram from the data above. Identify the equilibrium. Would you expect unemployment…
A: Total demand and total supply in the economy are referred to as aggregate demand and aggregate…
Q: The table below shows the initial aggregate demand, short-run, and long-run aggregate supply…
A: a) LAS is the vertical shape of the long term aggregate supply curve at real GDP of 800 in the graph…
Q: n the basic New Keynesian model, suppose that there is an increase in government spending. • First,…
A: The aggregate demand curve shows the inverse relationship between the price level and the total…
Q: d. According to the sticky-wage theory of aggregate supply, how do nominal wages at point A compare…
A: Aggregate demand is the sum of all the goods and services demanded by all the sectors in an economy.…
Q: The graph below depicts an economy where an increase in aggregate demand has caused inflation.…
A: A government generally regulates the market through fiscal measures, the measures can be of two…
Q: Consider an economy producing at Y, = 0 and ū = 1/4. The inflation rate at t = 0 is no = 3% . Now,…
A: The inflation rate, or rate of increase of a price index, is a measurement of inflation in economics…
Q: The economy of Moneyland has an actual unemployment rate that is less than the natural unemployment…
A: (a) Here, AD is the aggregate demand LRAS is the long run aggregate supply SRAS is the short run…
Q: As the Federal Reserve sharply raises rates in the face if substantial inflationary pressures,…
A: Inflationary pressure is the continuous increase in the general price level in an economy. During…
Q: Suppose that government decides to support the firms for their investments in research and the…
A:
Q: The graph below depicts an economy where an increase in aggregate demand has caused inflation.…
A: [a] To restore the aggregate demand, government had to reduce = 400-240 = $160 billion. Thus, the…
Q: Above is a graphical model of the AS-AD. In this model the initial level of the economy is at the…
A: The aggregate demand refers to the total amount of all the goods, and services demanded in an…
Q: Problem 1. Country A has the following Philips Curve: я- Еп- 0.75 (и-0.05) a) What is the natural…
A: Answer - "Thank you for submitting the question .But, we are authorized to solve only 3 sub parts.…
Q: One difference between the Great Recession and the Great Depression is that a) there was significant…
A: The situation which depicts a downward trend in the business cycle that is being depicted by a…
Q: Suppose that environmental regulations require firms to reduce emissions and pollution during…
A: At first the Aggregate demand and supply curve is as below:- Impact in short run:- At first the…
Q: 10. Which of the following are reasons why the short-run Aggregate Supply curve shown in the…
A: The curve that shows the aggregate quantity of goods and services supplied in a nation at different…
Q: (1) Draw a generic Aggregate Supply (AS) and Aggregate Demand (AD) curve on a set of axes. Label…
A: Goods market is in equilibrium where aggregate demand and aggregate supply intersect at certain…
Q: Suppose that government decides to support the firms for their investments in research and the…
A: Increase in productivity decreases production cost, so aggregate supply will rise, shifting SRAS…
Q: Using the AD (Aggregate Demand) and AS (Aggregate Supply) curves, explain the effectiveness of the…
A: Meaning of Aggregate Demand and Aggregate Supply: The term aggregate demand refers to the situation…
Q: Suppose the current administration decides to increase government expenditures as a means of…
A:
Q: QUESTION 9 Refer to the graphs, in which AD1 and AS1 are the "before" curves and AD2 and AS2 are the…
A: Cost-push inflation is a type of inflation that occurs when the economy is experiencing a price rise…
Q: Aggregate demand function is given by Y=7000-20P; the shirt-run aggregate supply function is given…
A: It is given that AD function is Y = 7000 – 20P AS function is Y = 6000 +…
Q: demand, short-run, and long-run aggregate supply schedules - Price level Aggregate demand (billion…
A:
Q: Suppose that the coronavirus pandemic (COVID 19) in 2020 has resulted in a leftward shift ofthe…
A: The corona virus pandemic has resulted in millions of job lost due to lockdown in all over the…
Q: In the graph of Figure I, the annual growth rate of the GDP of the United States economy is…
A: Consumption Function is defined as the function which portrays the relationship between the Real GDP…
Q: Assume the following macroeconomic conditions in the United States and that US policy makers desire…
A: In general, macroeconomic condition of an economy is analyzed with the help of its output growth,…
Q: What kind of problem is the U.S. economy facing? Give one possible reason why this problem may…
A: Note: Since you have posted a question with multiple subparts, we will solve the first three…
Q: Refer to the table below. Real Output Demanded, Original, Real Output Supplied, Billions Billions…
A: Answer: (a). If the real output demand increases by $11 billion at each price level then the real…
Q: If Aggregate Supply (Short-Run) increase while Aggregate Demand remains constant, which of the…
A: Desclaimer:- As you posted multiple questions we are solving the first one only. Aggregate supply…
Q: Suppose that government decides to support the firms for their investments in research and the…
A: Answer- Given in the question - Suppose that government decides to support the firms for their…
Q: Explain why the wages in an economy are downward rigid/sticky but not upward sticky. How does this…
A: In the theory of Keynesian economics, the main part is stickiness or wages and this concept has been…
Q: nomy. These measures caused the monetary base to increase from
A: 1. Real business Cycle - WOULD NOT SUPPORT FED ACTIONS - it is because the real business cycle…
Q: What are the two biggest recessions in terms of length and magnitude in the Graph. Remember shahded…
A: Recession refers to the situation where the growth rate of real GDP is negative over the previous…
Q: Cd= 200+.8Y - 500r Id= 200 – 500r Real interest rate r in the equilibrium equals .2. What is the…
A: The IS-LM model is based on the relationship between the rate of interest and the output of the…
Q: The country of Freeland has an aggregate demand curve determined by the equation Freeland also has a…
A: The quantity theory of money:The quantity theory of money equation can be written as follows:
Trending now
This is a popular solution!
Step by step
Solved in 2 steps
- Please no written by hand solution Consider the following economic situations:C = $4.0 trillionI = $1.5 trillionG = $3.0 trillionT = $3.0 trillionNX = $1.0 trillionF = 0mpc = 0.8d = 0.35x = 0.15r = 1% λ = 0.5A. Calculate an expression for the IS, MP and AD curves ( r= ?, IS Y= ?, AD Y=?)B. Let AS curve be given by the relation: π = 6 + 1.5 (Y - 25.5) (i.e. the price shock is zero). What are the equilibrium values of inflation, output and the real interest rate(π, Y, r)?C. Suppose government purchases are raised from $3.0 trillion to $3.5 trillion. What are new short-run equilibrium inflation values, output and the real interest rate (π, Y, r}?D. Suppose a financial crisis begins, and ƒ increases ƒ = 3. (Assume government purchases are again as in part (a). What are the new short-run equilibrium values of inflation, output, and the interest rate (π, Y, r}?(Please solve all the parts with numerical steps so it could be practiced easily)for question given below i =90 g=60 t= 25 c0 automous consum = 30 c1 marginal consum = 0,8 calculate the aggregate demand Y and savings rate sBased on the below information, help Renwick economy find the equilibrium level of output. Aggregate Demand Aggregate Supply Equilibrium YAD = C + I + G YAS = A Kα L1-α YR =0.5YAD+ 0.5YAS C = 600 + βYD A = (1 + g) Ao YD = YR + TR - tYR K = 35 TR = 55 L = 80 G = 120 g = 6% I = 50 Ao = 150 t = 0.15 α = 0.65 Where C is private consumption, YD is disposable income; TR, G and I are transfer payments, government spending and total investment, respectively. A in the index of technology and K and L are capital and labour inputs. A0 is the initial levels of A and L, both assumed to be 150, while g is the growth rates. The MPC is 0.60. a.) Find aggregate demand…
- 10. Which of the following are reasons why the short-run Aggregate Supply curve shown in the right-hand diagrams may be vertical? a) The economy at this level of real GDP would be operating beyond the full-employmetn level. b) Inflationary expectations have set-in so, the owners of resources are acting on these inflationary expectations and insisting on higher resource prices in anticipation of future products price inflation. c) Short-run Aggregate Suply in the Classical model is always constant. d) All the above e) Only (a) and (b) are true. f) None of the above.1. Using the AS-AD model, graph and explain the effects of Covid-19 on the U.S. macroeconomy by comparing 2019 vs. 2020. Label the years on all curves, the axis, and the equilibrium. Ignore macroeconomic policy responses, such as the CARES act. Which curves shifted which direction, and why? 2. Now introduce any macroeconomic policy response. What curves shift which direction, and why? 3. What were the equilibrium quantities for both axis?Consider an economy called Xanadu for which desired aggregate consumptiondepends on income, Y. and the real interest rate, r, according toCd =100+0.7Y - 200r.Xanadu's GDP is Y = 1000 and government spending on goods and services is G=180. Xanadu's desired future capital stock is given byK* = 140 - 100ucwhere luCdenotes the user-cost of capital. The price of capital is PK =2, thephysical depreciation rate is d =0.1 and the existing capital stock is K0= 50. Trapital stock between any period t and the following period t+1 evolves accordng toKt+1 = It+(1-d)Kt where It the level of investment. Assume throughout that net factor payments from abroad (NFP) is equal to zero.Suppose instead that Xanadu is a small open economy facing a world interest rate of 1%. It follows that Xanadu's current account position is equal toA) -16B) -51C) -6D) -8
- 18 - : If aggregate demand increases in an economy while aggregate demand is constant in the short run, which of the following statements is correct for the new equilibrium point?A) price decreases and national income increasesB) price rises national income risesC) price increases and national income does not changeD) price goes up and national income goes downE) price decreases and national income decreases.19 - : In which of the following expressions is the equation of change given correctly?A) MV=VK B) MT=PV C) MV=PT D) MP=VY E) MV=PA) Explain thoroughly how reducing recession works B) Explain why the presence of the built-instabilizer is important to managing the macroeconomy.Suppose that Dell Corporation has 20,000 computersin its warehouses on December 31, 2019, ready tobe shipped to merchants (each computer is valued at$500). By December 31, 2020, Dell Corporation has25,000 computers ready to be shipped, each valuedat $450.a. Calculate Dell’s inventory on December 31, 2019.b. Calculate Dell’s inventory investment in 2020.c. What happens to inventory spending during theearly stages of an economic recession?
- 1 As more of the nation s systems of river locks 1. As more of the nation’s systems of river locks become deficient, what is happening to the pace at which the U.S. production possibilities curve shifts outward over time? 2. How are deficiencies in the U.S. river system affecting the extent to which the U.S. long-run aggregate supply come shifts rightward each year? 1 As more of the nation s systems of river locksa) Consider that the Ghanaian economy is a Small and close, which ischaracterised by the following.AD=C+I+G+NXC=a+bY*Y*=disposalincomeT=T 0I=I 0G=G0Md/P=Ld(Y,i)Ms=money supply, which is given.AD=Aggregate demand, C=consumption, G=Government expenditure, T=Tax, P= Price level, I=Investment, NX=Net exportsa)Consider an increase in Government spending ∆ > .Assume for now thatboth price and expected price are fixed. Also assume that government doesnot implement any other policy than the increase in Government spending.What is the effect of this policy on the goods market? b)What is the effect on equilibriumin the money market? Present your answer ina well-labelled diagram, showing both money supply and demand before thepolicy was implemented, and that after the policy was implemented in thesame graph. c)Solve for equilibrium in the goods market.d)Suppose the policy change is rather an increase in real money supply not a decrease in government spending. What is the effect of this policy…09. The left-hand Which of the following statements is tru about the diagrams above depicting the macroeconommy in both Keynesian and Classical frameworks and a change from AEo to AE* and ADo to AD*? a) The left-hand diagrams show the effect of an increase in Aggregare Expenditures (and Aggregate Demand), where the short-run Aggregate Supply is horizontal, meaning a constant products price level. b) The right hand diagrams show the effect of an increase in Aggregate Expenditrues (and Aggregate DEmand), where short-run Aggregate Supply is vertical (constant Aggregate Quantity Supplied). c) The left-hand diagrams illustrate the Keynesian range of the shor-run Aggregate Supply curve, where Keynesian expansionary policy does not cause any inflation and thus is very effective. d) The right-hand diagrams illustrate the Classical or Monetarist range of the short-run Aggregate Supply curve, where Keynesian expansionary policy is totally dissipated in…