Although the Canadian and U.S. one-cent coins have slightly different dimensions and alloy compositions, the two types of pennies have similar masses. The table below lists the masses of individual pennies from each country measured using the same balance. Compare the two sets of one-cent coins by determining calculated. Refer to the table of Student's + values as necessary. Assume that the population standard deviation (o) for each data set is the same. t calculated 7.787 1 calculated Incorrect 2.595 1 2 3 4 5 6 7 8 9 10 Incorrect Canadian (g) 2.343 2.374 2.295 2.323 2.366 2.315 2.352 2.336 2.309 Suppose the number of replicate measurements and the average mass of an individual penny remain the same, but the standard deviation of each data set is three times greater than its original value. Calculate the t value to compare these two data sets. U.S. (g) 2.553 2.508 2.496 2.560 2.517 2.491 2.545 2.526 2.534 2.509 Are the masses of the Canadian and U.S. one-cent coins significantly different at the 98% confidence level? The difference is not significant. The difference is significant. For the second set of measurements, is there a significant difference in the masses of the two types of coins at the 98% confidence level?
Although the Canadian and U.S. one-cent coins have slightly different dimensions and alloy compositions, the two types of pennies have similar masses. The table below lists the masses of individual pennies from each country measured using the same balance. Compare the two sets of one-cent coins by determining calculated. Refer to the table of Student's + values as necessary. Assume that the population standard deviation (o) for each data set is the same. t calculated 7.787 1 calculated Incorrect 2.595 1 2 3 4 5 6 7 8 9 10 Incorrect Canadian (g) 2.343 2.374 2.295 2.323 2.366 2.315 2.352 2.336 2.309 Suppose the number of replicate measurements and the average mass of an individual penny remain the same, but the standard deviation of each data set is three times greater than its original value. Calculate the t value to compare these two data sets. U.S. (g) 2.553 2.508 2.496 2.560 2.517 2.491 2.545 2.526 2.534 2.509 Are the masses of the Canadian and U.S. one-cent coins significantly different at the 98% confidence level? The difference is not significant. The difference is significant. For the second set of measurements, is there a significant difference in the masses of the two types of coins at the 98% confidence level?

Mathematics For Machine Technology
8th Edition
ISBN:9781337798310
Author:Peterson, John.
Publisher:Peterson, John.
Chapter29: Tolerance, Clearance, And Interference
Section: Chapter Questions
Problem 16A: Spacers are manufactured to the mean dimension and tolerance shown in Figure 29-12. An inspector...

Related questions
Question
A4
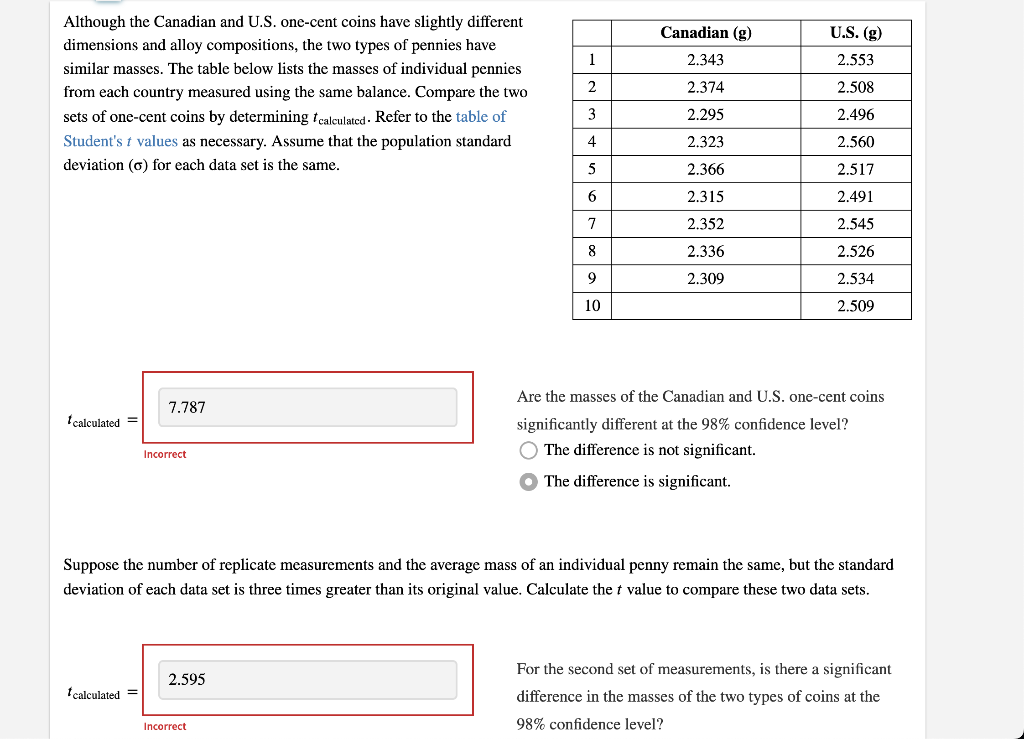
Transcribed Image Text:Although the Canadian and U.S. one-cent coins have slightly different
dimensions and alloy compositions, the two types of pennies have
similar masses. The table below lists the masses of individual pennies
from each country measured using the same balance. Compare the two
sets of one-cent coins by determining calculated. Refer to the table of
Student's t values as necessary. Assume that the population standard
deviation (o) for each data set is the same.
calculated =
7.787
1 calculated =
Incorrect
2.595
1
2
3
4
5
6
7
8
9
10
Incorrect
Canadian (g)
2.343
2.374
2.295
2.323
2.366
2.315
2.352
2.336
2.309
Suppose the number of replicate measurements and the average mass of an individual penny remain the same, but the standard
deviation of each data set is three times greater than its original value. Calculate the t value to compare these two data sets.
U.S. (g)
2.553
2.508
2.496
2.560
2.517
2.491
2.545
2.526
2.534
2.509
Are the masses of the Canadian and U.S. one-cent coins
significantly different at the 98% confidence level?
The difference is not significant.
The difference is significant.
For the second set of measurements, is there a significant
difference in the masses of the two types of coins at the
98% confidence level?
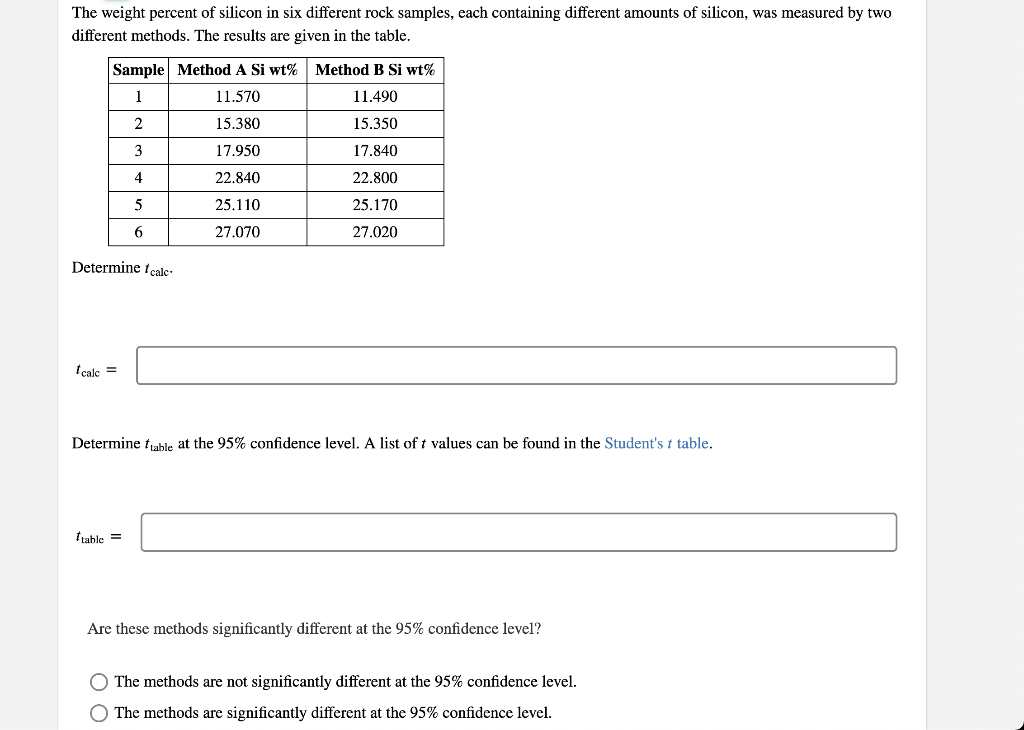
Transcribed Image Text:The weight percent of silicon in six different rock samples, each containing different amounts of silicon, was measured by two
different methods. The results are given in the table.
Sample Method A Si wt% Method B Si wt%
1
11.570
11.490
2
15.380
15.350
3
17.950
22,840
25.110
27.070
tcale =
4
Determine tcalc.
5
6
ttable =
17.840
22.800
25.170
27.020
Determine table at the 95% confidence level. A list of t values can be found in the Student's t table.
Are these methods significantly different at the 95% confidence level?
O The methods are not significantly different at the 95% confidence level.
O The methods are significantly different at the 95% confidence level.
Expert Solution
This question has been solved!
Explore an expertly crafted, step-by-step solution for a thorough understanding of key concepts.

This is a popular solution!

Trending now
This is a popular solution!

Step by step
Solved in 5 steps with 2 images

Recommended textbooks for you
Mathematics For Machine Technology
Advanced Math
ISBN:
9781337798310
Author:
Peterson, John.
Publisher:
Cengage Learning,
Mathematics For Machine Technology
Advanced Math
ISBN:
9781337798310
Author:
Peterson, John.
Publisher:
Cengage Learning,