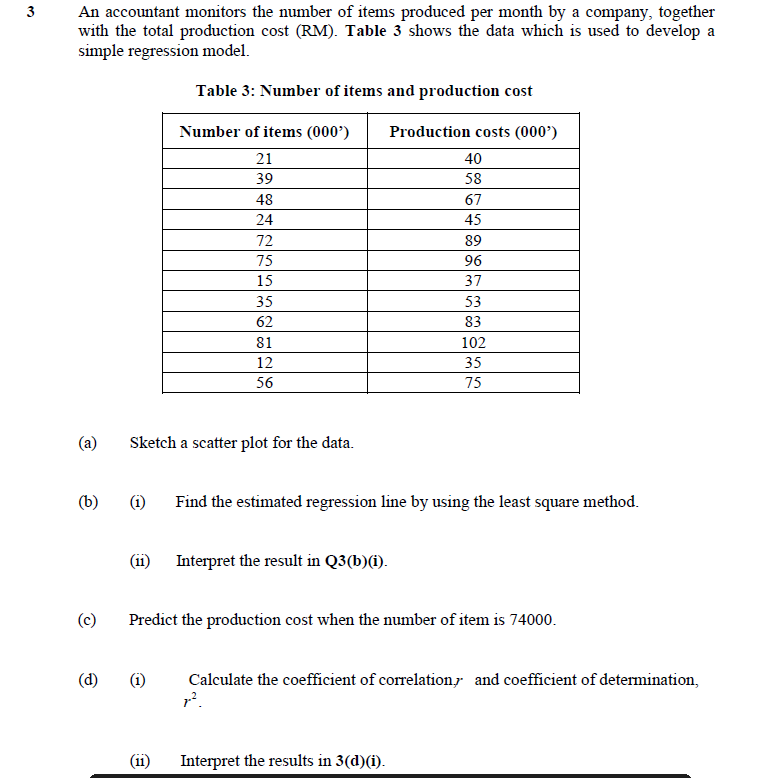
An accountant monitors the number of items produced per month by a company, together with the total production cost (RM). Table 3 shows the data which is used to develop a simple regression model. Table 3: Number of items and production cost Number of items (000') Production costs (000') 21 40 39 58 48 67 24 45 72 89 75 96 15 37 35 53 62 83 81 102 12 35 56 75 (a) Sketch a scatter plot for the data. (b) (i) Find the estimated regression line by using the least square method. (11) Interpret the result in Q3(b)(i). (c) Predict the production cost when the number of item is 74000. (d) (i) Calculate the coefficient of correlation, and coefficient of determination, (ii) Interpret the results in 3(d)(i). 3.
An accountant monitors the number of items produced per month by a company, together with the total production cost (RM). Table 3 shows the data which is used to develop a simple regression model. Table 3: Number of items and production cost Number of items (000') Production costs (000') 21 40 39 58 48 67 24 45 72 89 75 96 15 37 35 53 62 83 81 102 12 35 56 75 (a) Sketch a scatter plot for the data. (b) (i) Find the estimated regression line by using the least square method. (11) Interpret the result in Q3(b)(i). (c) Predict the production cost when the number of item is 74000. (d) (i) Calculate the coefficient of correlation, and coefficient of determination, (ii) Interpret the results in 3(d)(i). 3.

College Algebra
7th Edition
ISBN:9781305115545
Author:James Stewart, Lothar Redlin, Saleem Watson
Publisher:James Stewart, Lothar Redlin, Saleem Watson
Chapter1: Equations And Graphs
Section: Chapter Questions
Problem 10T: Olympic Pole Vault The graph in Figure 7 indicates that in recent years the winning Olympic men’s...

Related questions
Question
Transcribed Image Text:An accountant monitors the number of items produced per month by a company, together
with the total production cost (RM). Table 3 shows the data which is used to develop a
simple regression model.
Table 3: Number of items and production cost
Number of items (000')
Production costs (000')
21
40
39
58
48
67
24
45
72
89
75
96
15
37
35
53
62
83
81
102
12
35
56
75
(a)
Sketch a scatter plot for the data.
(b)
(i)
Find the estimated regression line by using the least square method.
(11) Interpret the result in Q3(b)(i).
(c)
Predict the production cost when the number of item is 74000.
(d)
(i)
Calculate the coefficient of correlation, and coefficient of determination,
(ii)
Interpret the results in 3(d)(i).
3.
Expert Solution
This question has been solved!
Explore an expertly crafted, step-by-step solution for a thorough understanding of key concepts.

Step by step
Solved in 4 steps with 4 images

Recommended textbooks for you
College Algebra
Algebra
ISBN:
9781305115545
Author:
James Stewart, Lothar Redlin, Saleem Watson
Publisher:
Cengage Learning

Algebra & Trigonometry with Analytic Geometry
Algebra
ISBN:
9781133382119
Author:
Swokowski
Publisher:
Cengage

Trigonometry (MindTap Course List)
Trigonometry
ISBN:
9781305652224
Author:
Charles P. McKeague, Mark D. Turner
Publisher:
Cengage Learning
College Algebra
Algebra
ISBN:
9781305115545
Author:
James Stewart, Lothar Redlin, Saleem Watson
Publisher:
Cengage Learning
Algebra & Trigonometry with Analytic Geometry
Algebra
ISBN:
9781133382119
Author:
Swokowski
Publisher:
Cengage
Trigonometry (MindTap Course List)
Trigonometry
ISBN:
9781305652224
Author:
Charles P. McKeague, Mark D. Turner
Publisher:
Cengage Learning

Algebra and Trigonometry (MindTap Course List)
Algebra
ISBN:
9781305071742
Author:
James Stewart, Lothar Redlin, Saleem Watson
Publisher:
Cengage Learning

Functions and Change: A Modeling Approach to Coll…
Algebra
ISBN:
9781337111348
Author:
Bruce Crauder, Benny Evans, Alan Noell
Publisher:
Cengage Learning