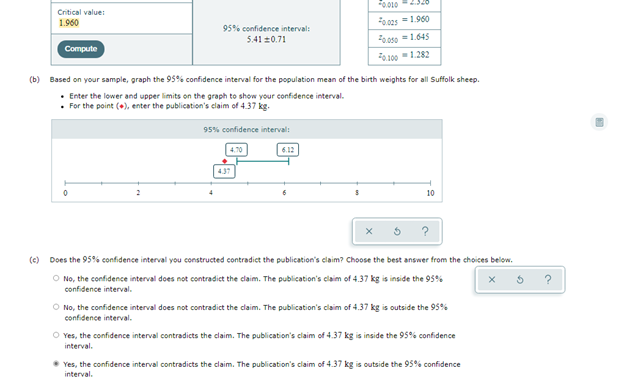
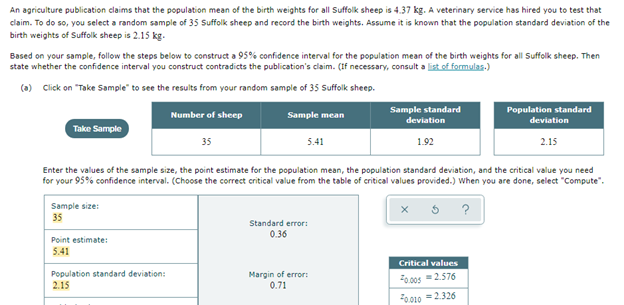
An agriculture publication claims that the population mean of the birth weights for all Suffolk sheep is 4.37 kg. A veterinary service has hired you to test that claim. To do so, you select a random sample of 35 Suffolk sheep and record the birth weights. Assume it is known that the population standard deviation of the birth weights of Suffolk sheep is 2.15 kg. Based on your sample, follow the steps below to construct a 95% confidence interval for the population mean of the birth weights for all Suffolk sheep. Then state whether the confidence interval you construct contradicts the publication's claim. (If necessary, consult a listof formulas-) (0) Click on "Take Sampie" to see the results from your random sample of 35 Suffolk sheep. Sample standard Population standard Number of sheep Sample mean deviation deviation Take Sample 35 5.41 192 2.15 Enter the values of the sample size, the point estimate for the population mean, the population standard deviation, and the critical value you need for your 95% confidence interval. (Choose the correct critical value from the table of critical values provided.) When you are done, select "Compute". Sample size: 35 Standard error: 0.36 Point estimate: 5.41 Critical values o 00s 2576 Population standard deviation: Margin of error 0.71 2.15


Unitary Method
The word “unitary” comes from the word “unit”, which means a single and complete entity. In this method, we find the value of a unit product from the given number of products, and then we solve for the other number of products.
Speed, Time, and Distance
Imagine you and 3 of your friends are planning to go to the playground at 6 in the evening. Your house is one mile away from the playground and one of your friends named Jim must start at 5 pm to reach the playground by walk. The other two friends are 3 miles away.
Profit and Loss
The amount earned or lost on the sale of one or more items is referred to as the profit or loss on that item.
Units and Measurements
Measurements and comparisons are the foundation of science and engineering. We, therefore, need rules that tell us how things are measured and compared. For these measurements and comparisons, we perform certain experiments, and we will need the experiments to set up the devices.
Could someone double check my answers please? I'm not feeling 100% confident. Thanks!


Trending now
This is a popular solution!

Step by step
Solved in 2 steps with 3 images


