An analyst must decide between two different forecasting techniques for weekly sales of roller blades: a linear trend equation and the naive approach. The linear trend equation is F. = 124 + 2.1t, and it was developed using data from periods 1 through 10. Based on data for periods 11 through 20 as shown in the table, which of these two methods has the greater accuracy if MAD and MSE are used? (Round your intermediate calculations and final answers to 2 decimal places.) Units Sold 11 144 12 146 13 152 14 142 15 152 16 149 17 152 18 154 19 157 164 20 Click here for the Excel Data File MAD (Naive) 5.11 MAD (Linear) MSE (Naive) MSE (Linear)
An analyst must decide between two different forecasting techniques for weekly sales of roller blades: a linear trend equation and the naive approach. The linear trend equation is F. = 124 + 2.1t, and it was developed using data from periods 1 through 10. Based on data for periods 11 through 20 as shown in the table, which of these two methods has the greater accuracy if MAD and MSE are used? (Round your intermediate calculations and final answers to 2 decimal places.) Units Sold 11 144 12 146 13 152 14 142 15 152 16 149 17 152 18 154 19 157 164 20 Click here for the Excel Data File MAD (Naive) 5.11 MAD (Linear) MSE (Naive) MSE (Linear)

Practical Management Science
6th Edition
ISBN:9781337406659
Author:WINSTON, Wayne L.
Publisher:WINSTON, Wayne L.
Chapter13: Regression And Forecasting Models
Section13.6: Moving Averages Models
Problem 22P: The file P13_22.xlsx contains total monthly U.S. retail sales data. While holding out the final six...

Related questions
Question
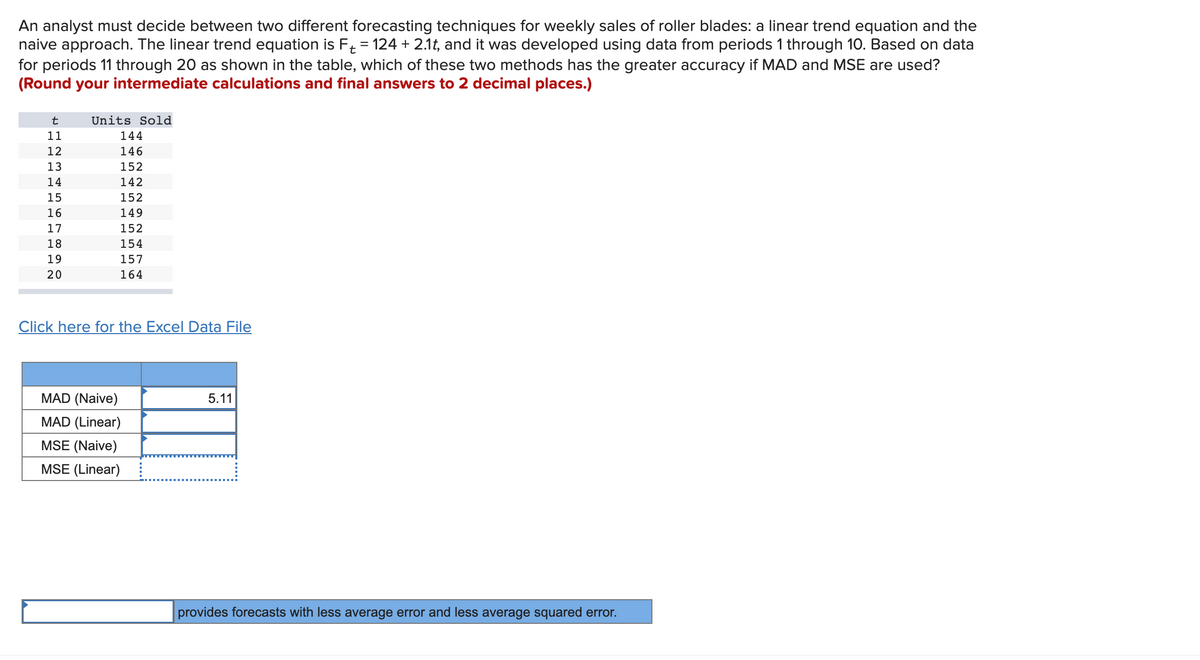
Transcribed Image Text:An analyst must decide between two different forecasting techniques for weekly sales of roller blades: a linear trend equation and the
naive approach. The linear trend equation is Ft = 124 + 2.1t, and it was developed using data from periods 1 through 10. Based on data
for periods 11 through 20 as shown in the table, which of these two methods has the greater accuracy if MAD and MSE are used?
(Round your intermediate calculations and final answers to 2 decimal places.)
Units Sold
11
144
146
13
152
14
142
15
152
16
149
17
152
18
154
19
157
20
164
Click here for the Excel Data File
MAD (Naive)
5.11
MAD (Linear)
MSE (Naive)
MSE (Linear)
provides forecasts with less average error and less average squared error.
H N M 4 56 r 00
Expert Solution
Step 1 : Introduction
Linear trend equation: . When t = 11, forecast for the 11th period will be
Forecasts for period 11 to 20 are shown below using the formula: .
In naive forecasting, last period's actual will be used as this period's forecast. So forecast for period 12 will be actuals of period 11 = 144

Trending now
This is a popular solution!

Step by step
Solved in 3 steps

Recommended textbooks for you
Practical Management Science
Operations Management
ISBN:
9781337406659
Author:
WINSTON, Wayne L.
Publisher:
Cengage,

Contemporary Marketing
Marketing
ISBN:
9780357033777
Author:
Louis E. Boone, David L. Kurtz
Publisher:
Cengage Learning

Marketing
Marketing
ISBN:
9780357033791
Author:
Pride, William M
Publisher:
South Western Educational Publishing
Practical Management Science
Operations Management
ISBN:
9781337406659
Author:
WINSTON, Wayne L.
Publisher:
Cengage,
Contemporary Marketing
Marketing
ISBN:
9780357033777
Author:
Louis E. Boone, David L. Kurtz
Publisher:
Cengage Learning
Marketing
Marketing
ISBN:
9780357033791
Author:
Pride, William M
Publisher:
South Western Educational Publishing