1. Calculate a forecast of the above demand using a three-month and a five-month moving average in a table. 2. In your table, include a column for computing the forecast errors for each of the moving average forecasts. Compute the error per period and then be sure to include the cumulative forecast error for each. You can find help with this in the instructor video in Content for the week. 3. Plot these forecasts AND the original demand data on graph paper or spreadsheet. Use a key to distinguish among your three lines.
1. Calculate a forecast of the above demand using a three-month and a five-month moving average in a table. 2. In your table, include a column for computing the forecast errors for each of the moving average forecasts. Compute the error per period and then be sure to include the cumulative forecast error for each. You can find help with this in the instructor video in Content for the week. 3. Plot these forecasts AND the original demand data on graph paper or spreadsheet. Use a key to distinguish among your three lines.

Practical Management Science
6th Edition
ISBN:9781337406659
Author:WINSTON, Wayne L.
Publisher:WINSTON, Wayne L.
Chapter2: Introduction To Spreadsheet Modeling
Section: Chapter Questions
Problem 20P: Julie James is opening a lemonade stand. She believes the fixed cost per week of running the stand...

Related questions

Question
Can you please solve all of them? Thank you!
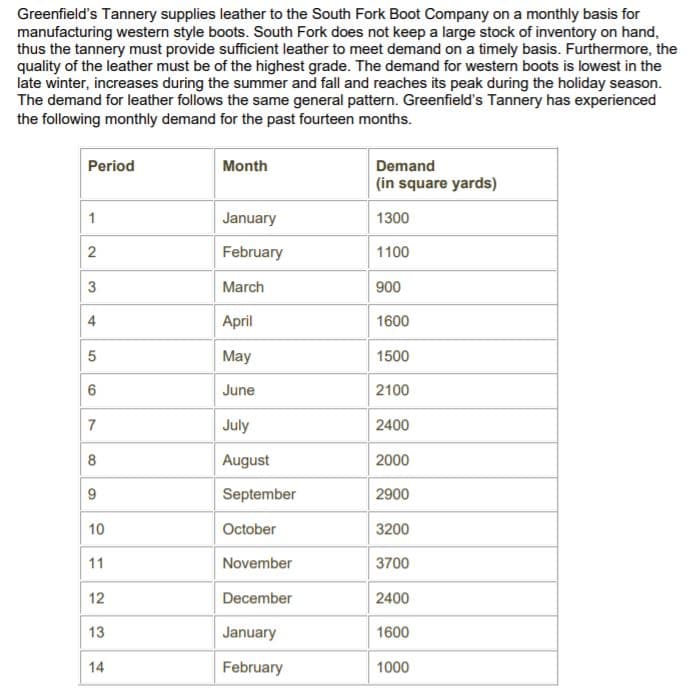
Transcribed Image Text:Greenfield's Tannery supplies leather to the South Fork Boot Company on a monthly basis for
manufacturing western style boots. South Fork does not keep a large stock of inventory on hand,
thus the tannery must provide sufficient leather to meet demand on a timely basis. Furthermore, the
quality of the leather must be of the highest grade. The demand for western boots is lowest in the
late winter, increases during the summer and fall and reaches its peak during the holiday season.
The demand for leather follows the same general pattern. Greenfield's Tannery has experienced
the following monthly demand for the past fourteen months.
Period
Month
Demand
(in square yards)
1
January
1300
February
1100
March
900
April
1600
5
May
1500
June
2100
7
July
2400
August
2000
9
September
2900
10
October
3200
11
November
3700
12
December
2400
13
January
1600
14
February
1000
2.
3.
4)
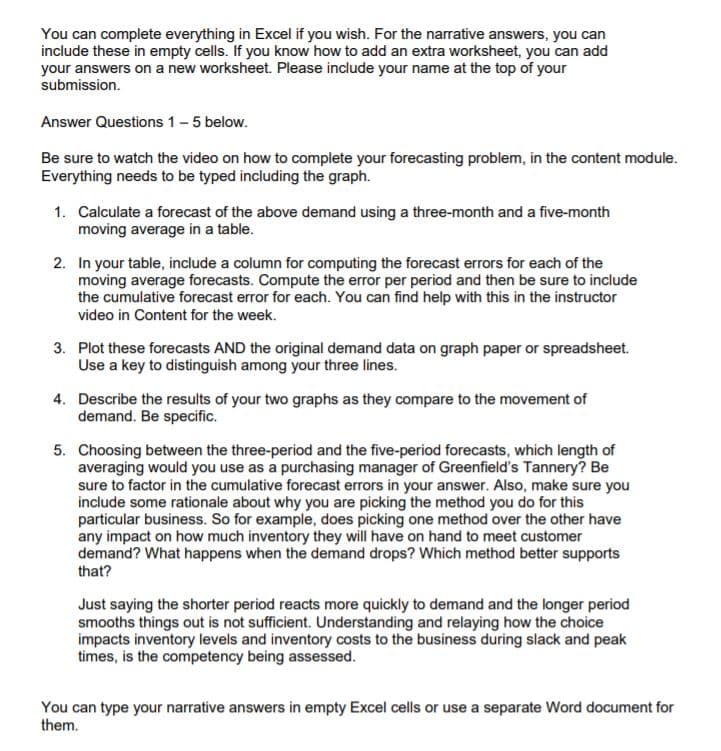
Transcribed Image Text:You can complete everything in Excel if you wish. For the narrative answers, you can
include these in empty cells. If you know how to add an extra worksheet, you can add
your answers on a new worksheet. Please include your name at the top of your
submission.
Answer Questions 1-5 below.
Be sure to watch the video on how to complete your forecasting problem, in the content module.
Everything needs to be typed including the graph.
1. Calculate a forecast of the above demand using a three-month and a five-month
moving average in a table.
2. In your table, include a column for computing the forecast errors for each of the
moving average forecasts. Compute the error per period and then be sure to include
the cumulative forecast error for each. You can find help with this in the instructor
video in Content for the week.
3. Plot these forecasts AND the original demand data on graph paper or spreadsheet.
Use a key to distinguish among your three lines.
4. Describe the results of your two graphs as they compare to the movement of
demand. Be specific.
5. Choosing between the three-period and the five-period forecasts, which length of
averaging would you use as a purchasing manager of Greenfield's Tannery? Be
sure to factor in the cumulative forecast errors in your answer. Also, make sure you
include some rationale about why you are picking the method you do for this
particular business. So for example, does picking one method over the other have
any impact on how much inventory they will have on hand to meet customer
demand? What happens when the demand drops? Which method better supports
that?
Just saying the shorter period reacts more quickly to demand and the longer period
smooths things out is not sufficient. Understanding and relaying how the choice
impacts inventory levels and inventory costs to the business during slack and peak
times, is the competency being assessed.
You can type your narrative answers in empty Excel cells or use a separate Word document for
them.
Expert Solution
This question has been solved!
Explore an expertly crafted, step-by-step solution for a thorough understanding of key concepts.

This is a popular solution!

Trending now
This is a popular solution!

Step by step
Solved in 4 steps with 4 images

Knowledge Booster


Learn more about
Need a deep-dive on the concept behind this application? Look no further. Learn more about this topic, operations-management and related others by exploring similar questions and additional content below.Recommended textbooks for you
Practical Management Science
Operations Management
ISBN:
9781337406659
Author:
WINSTON, Wayne L.
Publisher:
Cengage,

Operations Management
Operations Management
ISBN:
9781259667473
Author:
William J Stevenson
Publisher:
McGraw-Hill Education

Operations and Supply Chain Management (Mcgraw-hi…
Operations Management
ISBN:
9781259666100
Author:
F. Robert Jacobs, Richard B Chase
Publisher:
McGraw-Hill Education
Practical Management Science
Operations Management
ISBN:
9781337406659
Author:
WINSTON, Wayne L.
Publisher:
Cengage,
Operations Management
Operations Management
ISBN:
9781259667473
Author:
William J Stevenson
Publisher:
McGraw-Hill Education
Operations and Supply Chain Management (Mcgraw-hi…
Operations Management
ISBN:
9781259666100
Author:
F. Robert Jacobs, Richard B Chase
Publisher:
McGraw-Hill Education


Purchasing and Supply Chain Management
Operations Management
ISBN:
9781285869681
Author:
Robert M. Monczka, Robert B. Handfield, Larry C. Giunipero, James L. Patterson
Publisher:
Cengage Learning

Production and Operations Analysis, Seventh Editi…
Operations Management
ISBN:
9781478623069
Author:
Steven Nahmias, Tava Lennon Olsen
Publisher:
Waveland Press, Inc.