An article in the Journal of Sound and Vibration (Vol. 151, 1991, pp. 383-394) described a study investigating the relationship between noise exposure and hypertension. The following data are representative of those reported in the article. y 10 1 2 5 1 4 6 3 5 46 8 4 5797 6 x 60 63 65 70 70 70 80 90 80 80 85 89 90 90 90 90 94 100 100 100 (a) Test for significance of regression using a = 0.05. What is the P-value for this test? Round to 7 decimal places. (b) Estimate the standard errors of the slope and intercept. Standard error of the slope = i . (Round to four decimal places.) Standard error of the intercept = i . (Round to three decimal places.) (c) Test Ho: Bo = 0 versus H1: Bo # 0 using a = 0.05. Find the P-value for this test. i (Round to six decimal places.)
An article in the Journal of Sound and Vibration (Vol. 151, 1991, pp. 383-394) described a study investigating the relationship between noise exposure and hypertension. The following data are representative of those reported in the article. y 10 1 2 5 1 4 6 3 5 46 8 4 5797 6 x 60 63 65 70 70 70 80 90 80 80 85 89 90 90 90 90 94 100 100 100 (a) Test for significance of regression using a = 0.05. What is the P-value for this test? Round to 7 decimal places. (b) Estimate the standard errors of the slope and intercept. Standard error of the slope = i . (Round to four decimal places.) Standard error of the intercept = i . (Round to three decimal places.) (c) Test Ho: Bo = 0 versus H1: Bo # 0 using a = 0.05. Find the P-value for this test. i (Round to six decimal places.)

Linear Algebra: A Modern Introduction
4th Edition
ISBN:9781285463247
Author:David Poole
Publisher:David Poole
Chapter7: Distance And Approximation
Section7.3: Least Squares Approximation
Problem 31EQ

Related questions
Question
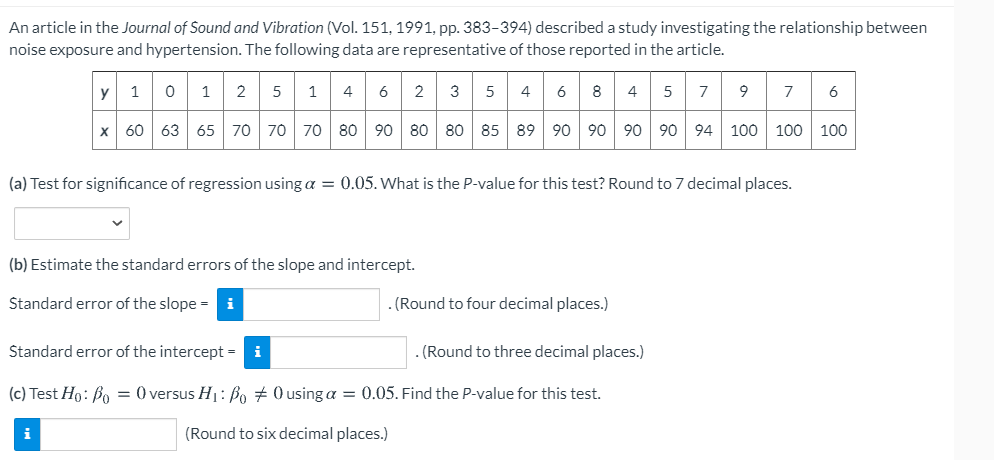
Transcribed Image Text:An article in the Journal of Sound and Vibration (Vol. 151, 1991, pp. 383-394) described a study investigating the relationship between
noise exposure and hypertension. The following data are representative of those reported in the article.
2 5
468 4
5 7
y
1
6
2
3
5
7
x 60 63 65 70 70 70 80 90 80 80 85 89 90 90 90 90 94 100 100 100
(a) Test for significance of regression using a = 0.05. What is the P-value for this test? Round to 7 decimal places.
(b) Estimate the standard errors of the slope and intercept.
Standard error of the slope = i
(Round to four decimal places.)
Standard error of the intercept = i
(Round to three decimal places.)
(c) Test Ho: Bo = 0 versus H: Bo + 0 using a = 0.05. Find the P-value for this test.
i
(Round to six decimal places.)
Expert Solution
This question has been solved!
Explore an expertly crafted, step-by-step solution for a thorough understanding of key concepts.

This is a popular solution!

Trending now
This is a popular solution!

Step by step
Solved in 2 steps with 5 images

Recommended textbooks for you
Linear Algebra: A Modern Introduction
Algebra
ISBN:
9781285463247
Author:
David Poole
Publisher:
Cengage Learning

Glencoe Algebra 1, Student Edition, 9780079039897…
Algebra
ISBN:
9780079039897
Author:
Carter
Publisher:
McGraw Hill
Linear Algebra: A Modern Introduction
Algebra
ISBN:
9781285463247
Author:
David Poole
Publisher:
Cengage Learning
Glencoe Algebra 1, Student Edition, 9780079039897…
Algebra
ISBN:
9780079039897
Author:
Carter
Publisher:
McGraw Hill