An article in Wear (1992, Vol. 152, pp. 171-181) presents data on the fretting wear of mild steel and oil viscosity. Representative data follow with x = oil viscosity and y= wear volume (10-4 cubic millimeters). y 240 181 193| 155 172 110 113 75 94 x 1.6 9.4 15.5 20.0 22.0 35.5 | 43.0 40.5 33.O Round your answers to two decimal places (e.g. 98.76). (a) Construct a scatter plot of the data. Does a simple linear regression model appear to be plausible? O No
An article in Wear (1992, Vol. 152, pp. 171-181) presents data on the fretting wear of mild steel and oil viscosity. Representative data follow with x = oil viscosity and y= wear volume (10-4 cubic millimeters). y 240 181 193| 155 172 110 113 75 94 x 1.6 9.4 15.5 20.0 22.0 35.5 | 43.0 40.5 33.O Round your answers to two decimal places (e.g. 98.76). (a) Construct a scatter plot of the data. Does a simple linear regression model appear to be plausible? O No

Linear Algebra: A Modern Introduction
4th Edition
ISBN:9781285463247
Author:David Poole
Publisher:David Poole
Chapter7: Distance And Approximation
Section7.3: Least Squares Approximation
Problem 31EQ

Related questions
Question
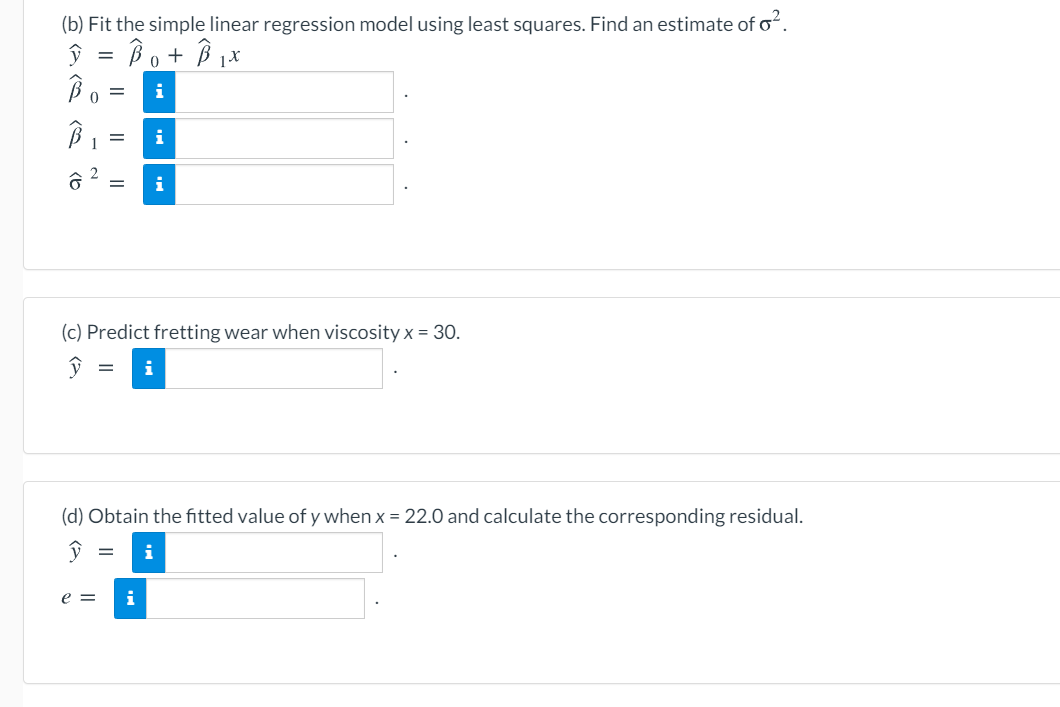
Transcribed Image Text:(b) Fit the simple linear regression model using least squares. Find an estimate of o.
Bo+ B iX
i
i
(c) Predict fretting wear when viscosity x = 30.
(d) Obtain the fitted value of y when x = 22.0 and calculate the corresponding residual.
i
e =
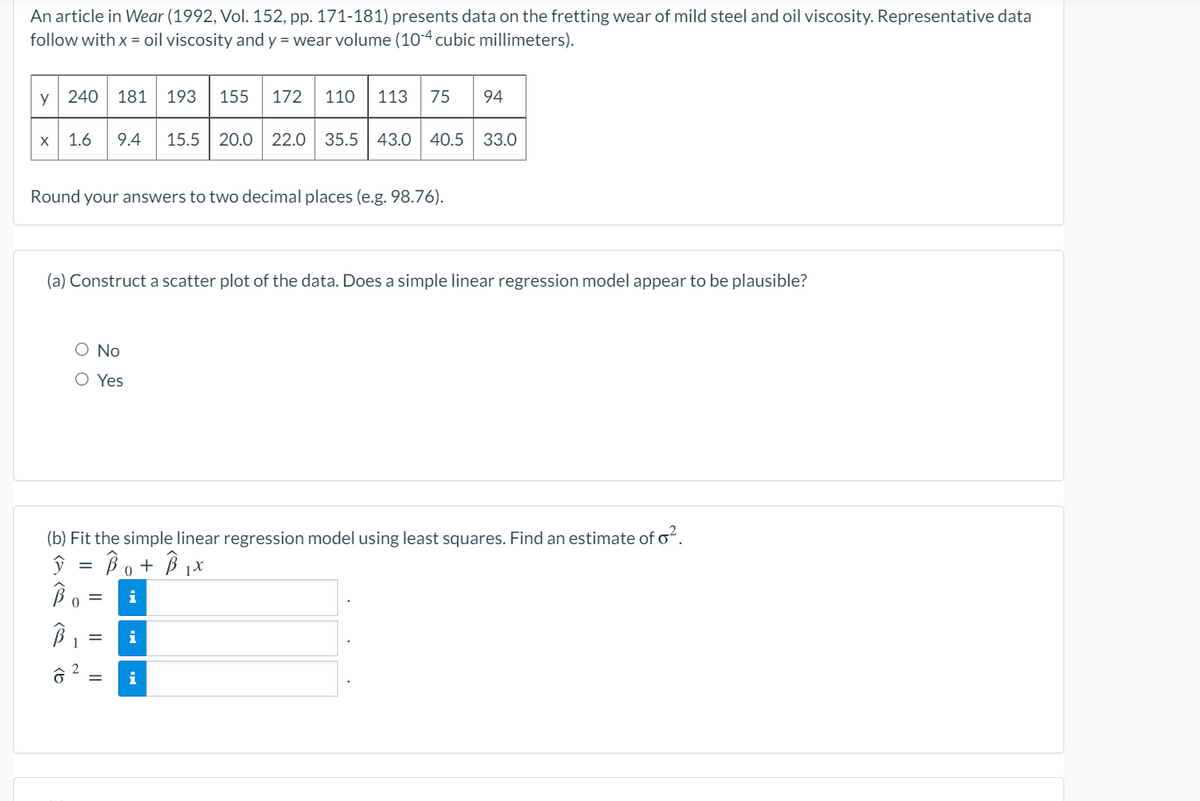
Transcribed Image Text:An article in Wear (1992, Vol. 152, pp. 171-181) presents data on the fretting wear of mild steel and oil viscosity. Representative data
follow with x = oil viscosity and y = wear volume (10-4 cubic millimeters).
y 240
181
193
155
172
110
113
75
94
1.6
9.4
15.5
20.0
22.0
35.5 43.0 40.5
33.0
Round your answers to two decimal places (e.g. 98.76).
(a) Construct a scatter plot of the data. Does a simple linear regression model appear to be plausible?
O No
O Yes
(b) Fit the simple linear regression model using least squares. Find an estimate of o.
Bo+ B1x
B.
i
i
i
Expert Solution
This question has been solved!
Explore an expertly crafted, step-by-step solution for a thorough understanding of key concepts.

This is a popular solution!

Trending now
This is a popular solution!

Step by step
Solved in 2 steps with 1 images

Recommended textbooks for you
Linear Algebra: A Modern Introduction
Algebra
ISBN:
9781285463247
Author:
David Poole
Publisher:
Cengage Learning

Glencoe Algebra 1, Student Edition, 9780079039897…
Algebra
ISBN:
9780079039897
Author:
Carter
Publisher:
McGraw Hill

Big Ideas Math A Bridge To Success Algebra 1: Stu…
Algebra
ISBN:
9781680331141
Author:
HOUGHTON MIFFLIN HARCOURT
Publisher:
Houghton Mifflin Harcourt
Linear Algebra: A Modern Introduction
Algebra
ISBN:
9781285463247
Author:
David Poole
Publisher:
Cengage Learning
Glencoe Algebra 1, Student Edition, 9780079039897…
Algebra
ISBN:
9780079039897
Author:
Carter
Publisher:
McGraw Hill
Big Ideas Math A Bridge To Success Algebra 1: Stu…
Algebra
ISBN:
9781680331141
Author:
HOUGHTON MIFFLIN HARCOURT
Publisher:
Houghton Mifflin Harcourt