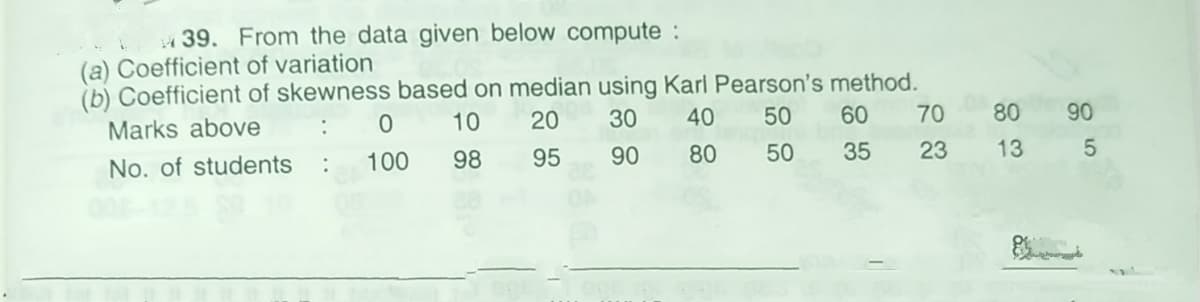
39. From the data given below compute : (a) Coefficient of variation (b) Coefficient of skewness based on median using Karl Pearson's method. Marks above 10 20 30 40 50 60 70 80 90 No. of students : 100 98 95 90 80 50 35 23 13
Q: Calculate coefficient of quartile deviation and coefficient of variation from the following data…
A:
Q: . Calculate standard deviation and coefficient of variation from the data given below: Mid-points :…
A:
Q: Answer #28 - #34 using this data set: f 7 1 4 3 4 1 3 1 2 2 1 3 32. What is the median? (SHOW YOUR…
A: Given: The following is the data. X f 7…
Q: A magazine claims that the mean amount spent by a customer at Burger Stop is greater than the mean…
A: GivenFor Burger stopx1=5.46s1=0.89n1=22For Fry Worldx2=5.12s2=0.79n2=30α=0.05
Q: The following data showing the heights of plants of two varieties of wheat:- Variety 1 Variety 2…
A: The given data is, Variety 1 Variety 2 87 82 91 84 89 85 88 83 89 90 91 89 87 94…
Q: * * * 23. Calculate the coefficient of skewness from the following data : 20 18 Mid-point: Frequency…
A:
Q: Here is part of a calculation in a spreadsheet working with population data of x. Which statement is…
A:
Q: Consider the following ANOVA table: Source of Variation SS df MS F Treatments 4 2…
A: Solution treatment refers to a level of the independent variable included in the model.
Q: 1 (a) The following data shows the number of goals scored by 33 teams in a season for a professional…
A: Solution We have to construct a Box and Whisker plot. So a Box and Whisker plot looks like as…
Q: Calculate the coefficient of skewness from the following data : e'noerse he Mid-point : Frequency :…
A:
Q: Compute the coefficient of variation of each data. Which of the two twine types is more uniform in…
A: Mean: For a set of n observations, x1, x2, ... , xn, mean is given by, Standard deviation: For a…
Q: A survey is conducted to young adults after they tasted a new brand of soda. Their satisfaction…
A: Introduction: A box and whiskers plot shows the spread of the data. It shows a five-point summary.…
Q: Listed below are amounts (in millions of dollars) collected from parking meters by a security…
A: Dear student, If you find this solution helpful please upvote ? it.
Q: 9. Find the quartile and median as well as coefficient of skewness from the following figures :…
A:
Q: Compute for the mean, median, mode, range, variance and standard deviation for the table below.…
A: Given: Class Interval f 70-72 2 67-69 2 64-66 4 61-63 5 58-60 11 55-57 8 52-54 4…
Q: 3. Calculate 6th decile,Median, Mode & cofficent of variation from the following data. X 10.8 10.6…
A: Given, X f 10.8 16 10.6 29 10.4 45 10.2 54 10 69 9.8 74 9.6 53 9.4 49 9.2 74…
Q: 22 Find the median, two quartiles and Bowely's coefficient of skewness or the following data : farks…
A: Given data : Marks below 10 20 30 40 50 60 70 80 No. of students 15 35 60 84 96 127 198 250
Q: The following data showing the heights of plants of two varieties of wheat:- Variety 1 Variety 2…
A: Given Variety 1 Variety 2 87 91 89 88 89 91 87 92 93 98 95 97 96 100 100 101 98 82 84 85…
Q: The following bivariate data set contains an outlier. x y 37.5 99 58 43.5 30 118.7 34 60.3 35.1…
A: As per our guidelines, we are allowed to answer first three sub-parts only. Thanks Given Data :…
Q: The following table gives the marks obtained by 65 students in statistics in a certain examination.…
A: Central tendency is used to measure the average of the data set. Median is the measure of central…
Q: Find the variance in classified data set (k=5) Sınıflandırılmış verilerde varyansı bulunuz (k=5) 17…
A: Given data : 17 , 20 , 23 , 26 , 28 , 31 , 37 , 40 , 40 , 40 , 40 , 40 , 44 , 49 , 50 , 55 , 60 , 63…
Q: Calculate the value of r with the Concurrent deviation method for the following data. X: 15 14 21 14…
A: The following data is given: x Y 15 31 14 46 21 31 14 42 18 40 32 36 19 30 18 29…
Q: The file contains the amount that a sample of nine customers spent for lunch ($) at a fast-food…
A: Observation: XX X^2X2 1 4.20 17.64 2 5.03 25.3009 3 5.86 34.3396 4 6.45 41.6025 5 7.38…
Q: a. Find the median of the sample and compare it to the mean and discuss the difference. b. Find the…
A:
Q: Find the interquartile range and the Coefficient of quartile deviation from the followine data Marks…
A:
Q: The data below are concerning the concentration of thiol in the blood lysate. 1.84 1.92 1.94 1.92…
A: A) The data below are concerning the concentration of thiol in the blood lysate. 1.84 1.92 1.94 1.92…
Q: Data were collected on the number of hospital stays per 65-year-old adult during the previous five…
A: Solution: Number of hospital( x) Number of adutls (f) fx x^2 fx^2 cumulative frequency (<…
Q: The data of 10 plots each, under two treatments are given below : Treatment I 46 45 32 42 39 48 49…
A: ANSWER: From the given data,
Q: For the following table, the ascending order (sachaill wwjill) of samples and their data spread is:…
A: GIven data
Q: Calculate the mean deviation from median and its coefficient of the following data: X : 0 1 2 3 4 5…
A:
Q: Q. 7. Calculate median from the data given below : Class Interval: 0-10 10-20 20-30 30-40 No. of…
A:
Q: The coefficient of variation for the following data is 60, 47,75, 85, 58 O A. 23.05% O B. 25.23% O…
A:
Q: The mean is equal to of cellular phones of sold per day is therefore, it means that the average…
A: Given: x p(x) 15 0.3 18 0.2 19 0.2 20 0.15 22 0.15
Q: 16. From the following data calculate median: No. of Students Marks Marks No. of Students Less than…
A:
Q: Calculate coefficient of quartile deviation and coefficient of variation from the following data :…
A:
Q: From the data set, get the output from excel. Compute the coefficient of variation, standard error,…
A: First we enter the given data set in Excel sheet. Coefficient of variation= standard deviation/mean…
Q: The following table gives the data pertaining to kilowatt hours of electricity consumed in a month…
A:
Q: The Highway Patrol, using radar, checked the speeds (in mph) of 30 passing motorists at a…
A: Given data : 1, 35, 35, 36, 36, 37, 38, 38, 39, 40, 40, 41, 41, 41, 42, 42, 43, 43, 43, 44, 45, 45,…
Q: The Variance of Population for the following data :X = 155, 175, 125, 155, 175, 195, 185, 525, 255,…
A:
Q: A sample of 12 small accounting firms reveals the following numbers of professionals per office. 7…
A: The coefficient of variation (CV) is a statistical measure of data points' dispersion around the…
Q: The following data show the monthly rental price (in $) for a random sample of one- bedroom…
A: Descriptive statistics
Q: decimal places
A:
Q: Using this data, find the variance for between subjects. Round your final answer to the nearest 2…
A: The data are given, Here we want to study on the effects of the amount of tacos eaten per week and…
Q: The data show the lengths (in feet) of suspension bridges in the eastern part of North America and…
A: The sample mean and sample standard deviation of the eastern part of North America is, The…
Q: d. Compute the sample correlation coefficient between the number of defective parts found and the…
A: 1) Solution: Let x =Line Speed and y = Number of defective parts x y xy x^2 y^2 20 21 420…
Q: The Highway Patrol, using radar, checked the speeds (in mph) of 30 passing motorists at a…
A: Given data : 4, 35, 35, 36, 36, 37, 38, 38, 39, 40, 40, 41, 41, 41, 42, 42, 43, 43, 43, 44, 45, 45,…
Q: The following data show the monthly rental price (in $) for a random sample of one- bedroom…
A: Given :- Mean=700 Tabular data of monthly rental price.we need to determine the median,variance.…
Q: Below is a summary table from an analysis of variance in which means from three groups are compared.…
A: Given that: Sources SS df MS F Between-groups 29.78 Within-groups 2.36 Total…
Step by step
Solved in 3 steps with 3 images