An Economics instructor assigns a class to investigate factors associated with the gross domestic product (GDP) of nations. Each student examines a different factor (such as life expectancy, literacy rate, etc.) for a few countries and reports to the class. Apparently, some of the classmates do not understand Statistics very well because several of their conclusions are incorrect. Explain the mistakes in comments a and b below. a) Explain the mistake in the statement "There was a very strong correlation of 1.22 between Life Expectancy and GDP." Choose the correct answer below. O A. A correlation that is close to 1 implies a very weak correlation. The correlation must be close to 10 for it to be interpreted as a very strong correlation. O B. A correlation cannot be greater than 1. OC. A correlation that is greater than 1 implies a weak correlation, not a strong correlation. O D. A correlation that is greater than 1 implies that the variables are not quantitative, so the correlation cannot be interpreted. b) Explain the mistake in the following statement. "The correlation between Literacy Rate and GDP was 0.83. This shows that countries wanting to increase their standard of living should invest heavily in education." Choose the correct answer below. O A. Assuming that the relation is linear, the strong correlation shows a relation between Literacy Rate and GDP, but this does not show causality. O B. The corelation indicates that an increase in the standard of living would result in an increase in the spending in education, but it cannot imply the reverse, which is that an increase in the spending in education would increase the standard of living. OC. Since GDP is a qualitative variable instead of a quantitative variable, no meaningful interpretation can be drawn from the correlation. O D. A correlation of 0.83 is too weak draw a meaning conclusion about the relation between Literacy Rate and GDP.
An Economics instructor assigns a class to investigate factors associated with the gross domestic product (GDP) of nations. Each student examines a different factor (such as life expectancy, literacy rate, etc.) for a few countries and reports to the class. Apparently, some of the classmates do not understand Statistics very well because several of their conclusions are incorrect. Explain the mistakes in comments a and b below. a) Explain the mistake in the statement "There was a very strong correlation of 1.22 between Life Expectancy and GDP." Choose the correct answer below. O A. A correlation that is close to 1 implies a very weak correlation. The correlation must be close to 10 for it to be interpreted as a very strong correlation. O B. A correlation cannot be greater than 1. OC. A correlation that is greater than 1 implies a weak correlation, not a strong correlation. O D. A correlation that is greater than 1 implies that the variables are not quantitative, so the correlation cannot be interpreted. b) Explain the mistake in the following statement. "The correlation between Literacy Rate and GDP was 0.83. This shows that countries wanting to increase their standard of living should invest heavily in education." Choose the correct answer below. O A. Assuming that the relation is linear, the strong correlation shows a relation between Literacy Rate and GDP, but this does not show causality. O B. The corelation indicates that an increase in the standard of living would result in an increase in the spending in education, but it cannot imply the reverse, which is that an increase in the spending in education would increase the standard of living. OC. Since GDP is a qualitative variable instead of a quantitative variable, no meaningful interpretation can be drawn from the correlation. O D. A correlation of 0.83 is too weak draw a meaning conclusion about the relation between Literacy Rate and GDP.

Glencoe Algebra 1, Student Edition, 9780079039897, 0079039898, 2018
18th Edition
ISBN:9780079039897
Author:Carter
Publisher:Carter
Chapter4: Equations Of Linear Functions
Section4.5: Correlation And Causation
Problem 11PPS

Related questions

Concept explainers
Contingency Table
A contingency table can be defined as the visual representation of the relationship between two or more categorical variables that can be evaluated and registered. It is a categorical version of the scatterplot, which is used to investigate the linear relationship between two variables. A contingency table is indeed a type of frequency distribution table that displays two variables at the same time.
Binomial Distribution
Binomial is an algebraic expression of the sum or the difference of two terms. Before knowing about binomial distribution, we must know about the binomial theorem.
Topic Video
Question
5
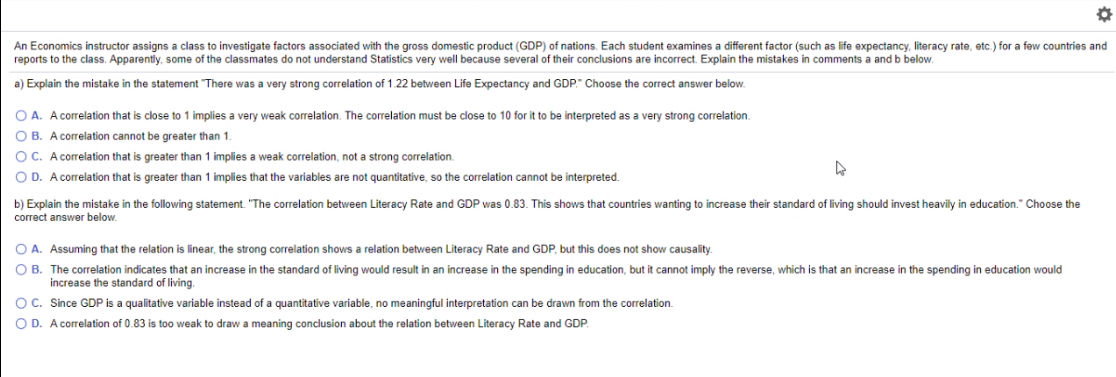
Transcribed Image Text:An Economics instructor assigns a class to investigate factors associated with the gross domestic product (GDP) of nations. Each student examines a different factor (such as life expectancy, literacy rate, etc.) for a few countries and
reports to the class. Apparently, some of the classmates do not understand Statistics very well because several of their conclusions are incorrect. Explain the mistakes in comments a and b below.
a) Explain the mistake in the statement "There was a very strong correlation of 1.22 between Life Expectancy and GDP." Choose the correct answer below.
O A. A correlation that is close to 1 implies a very weak correlation. The correlation must be close to 10 for it to be interpreted as a very strong correlation.
O B. A correlation cannot be greater than 1.
OC. A correlation that is greater than 1 implies a weak correlation, not a strong correlation.
O D. A correlation that is greater than 1 implies that the variables are not quantitative, so the correlation cannot be interpreted.
b) Explain the mistake in the following statement. "The correlation between Literacy Rate and GDP was 0.83. This shows that countries wanting to increase their standard of living should invest heavily in education." Choose the
correct answer below.
O A. Assuming that the relation is linear, the strong correlation shows a relation between Literacy Rate and GDP, but this does not show causality.
O B. The correlation indicates that an increase in the standard of living would result in an increase in the spending in education, but it cannot imply the reverse, which is that an increase in the spending in education would
increase the standard of living.
OC. Since GDP is a qualitative variable instead of a quantitative variable, no meaningful interpretation can be drawn from the correlation.
O D. A correlation of 0.83 is too weak
draw a meaning conclusion about the relation between Literacy Rate and GDP.
Expert Solution
This question has been solved!
Explore an expertly crafted, step-by-step solution for a thorough understanding of key concepts.

This is a popular solution!

Trending now
This is a popular solution!

Step by step
Solved in 2 steps

Knowledge Booster


Learn more about
Need a deep-dive on the concept behind this application? Look no further. Learn more about this topic, statistics and related others by exploring similar questions and additional content below.Recommended textbooks for you
Glencoe Algebra 1, Student Edition, 9780079039897…
Algebra
ISBN:
9780079039897
Author:
Carter
Publisher:
McGraw Hill

Big Ideas Math A Bridge To Success Algebra 1: Stu…
Algebra
ISBN:
9781680331141
Author:
HOUGHTON MIFFLIN HARCOURT
Publisher:
Houghton Mifflin Harcourt

Holt Mcdougal Larson Pre-algebra: Student Edition…
Algebra
ISBN:
9780547587776
Author:
HOLT MCDOUGAL
Publisher:
HOLT MCDOUGAL
Glencoe Algebra 1, Student Edition, 9780079039897…
Algebra
ISBN:
9780079039897
Author:
Carter
Publisher:
McGraw Hill
Big Ideas Math A Bridge To Success Algebra 1: Stu…
Algebra
ISBN:
9781680331141
Author:
HOUGHTON MIFFLIN HARCOURT
Publisher:
Houghton Mifflin Harcourt
Holt Mcdougal Larson Pre-algebra: Student Edition…
Algebra
ISBN:
9780547587776
Author:
HOLT MCDOUGAL
Publisher:
HOLT MCDOUGAL