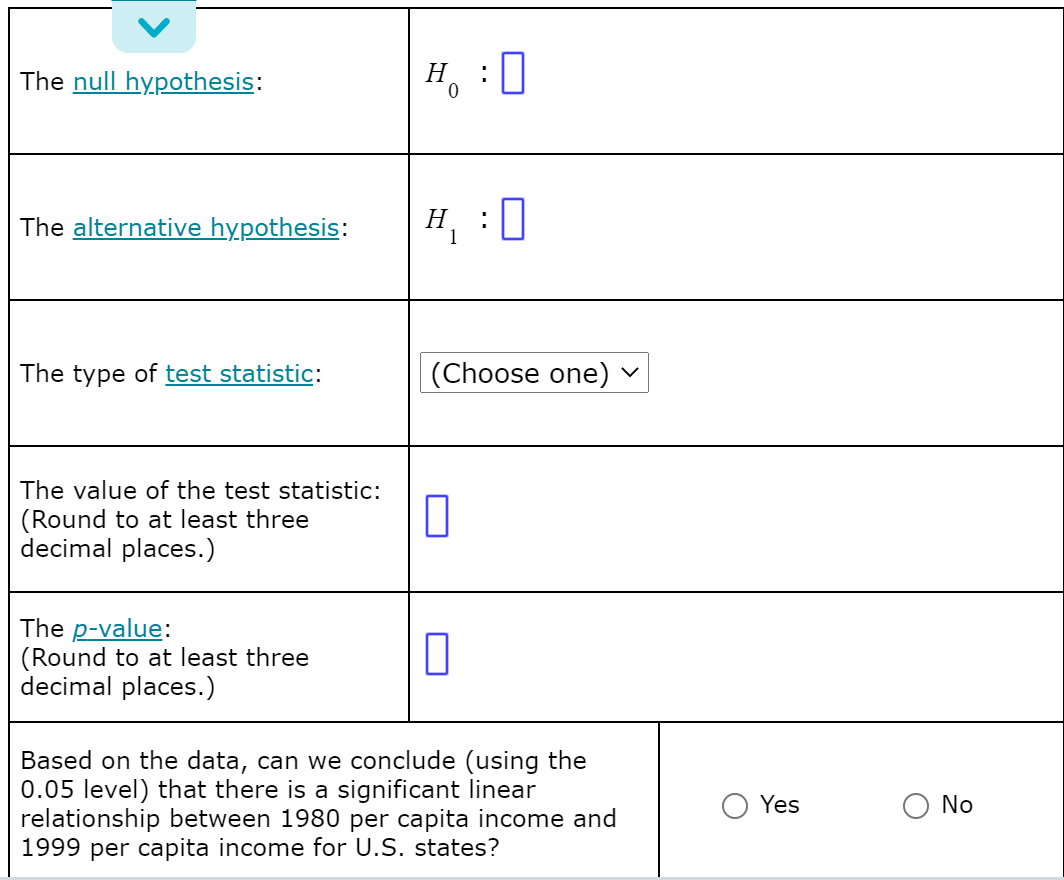
In ongoing economic analyses, the U.S. federal government compares per capita incomes not only among different states but also for the same state at different times. For the 50 states, the sample correlation coefficient relating the 1980 per capita income and the 1999 per capita income is approximately 0.32 (source: U.S. Bureau of Economic Analysis, Survey of Current Business, May 2000). Based on this information, test for a significant linear relationship between the variables 1980 per capita income and 1999 per capita income by doing a hypothesis test regarding the population correlation coefficient p. (Assume that the two variables have a bivariate normal distribution.) Use the 0.05 level of significance, and perform a two-tailed test. Then fill in the table below. (If necessary, consult a list of formulas.)


Correlation
Correlation defines a relationship between two independent variables. It tells the degree to which variables move in relation to each other. When two sets of data are related to each other, there is a correlation between them.
Linear Correlation
A correlation is used to determine the relationships between numerical and categorical variables. In other words, it is an indicator of how things are connected to one another. The correlation analysis is the study of how variables are related.
Regression Analysis
Regression analysis is a statistical method in which it estimates the relationship between a dependent variable and one or more independent variable. In simple terms dependent variable is called as outcome variable and independent variable is called as predictors. Regression analysis is one of the methods to find the trends in data. The independent variable used in Regression analysis is named Predictor variable. It offers data of an associated dependent variable regarding a particular outcome.


Trending now
This is a popular solution!

Step by step
Solved in 2 steps with 2 images


