
MATLAB: An Introduction with Applications
6th Edition
ISBN: 9781119256830
Author: Amos Gilat
Publisher: John Wiley & Sons Inc
expand_more
expand_more
format_list_bulleted
Topic Video
Question
thumb_up100%

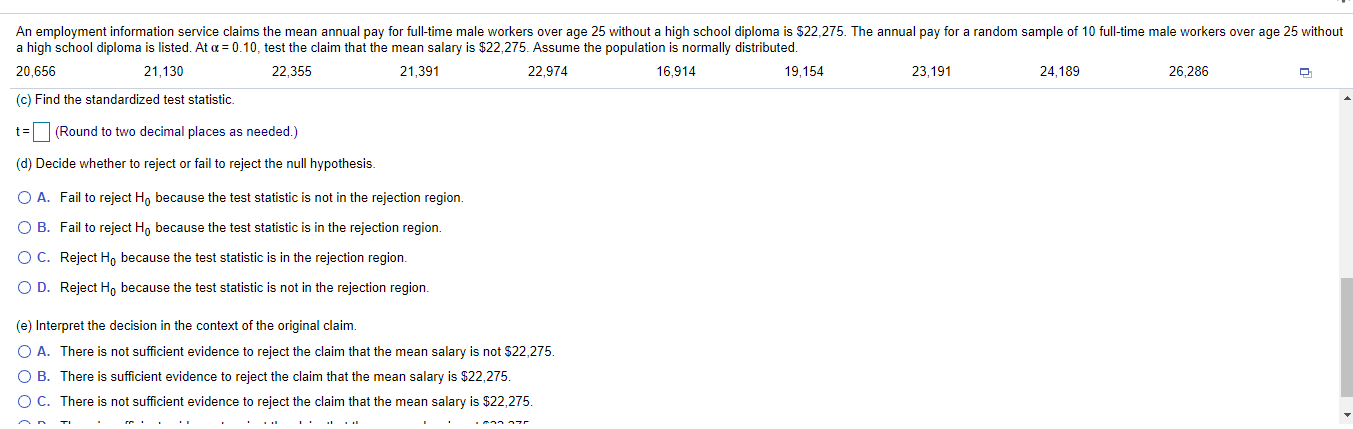
Transcribed Image Text:An employment information service claims the mean annual pay for full-time male workers over age 25 without a high school diploma is $22,275. The annual pay for a random sample of 10 full-time male workers over age 25 without
a high school diploma is listed. At a = 0.10, test the claim that the mean salary is $22,275. Assume the population is normally distributed.
20,656
21,130
22,355
21,391
22,974
16,914
19,154
23,191
24,189
26,286
(c) Find the standardized test statistic.
t= (Round to two decimal places as needed.)
(d) Decide whether to reject or fail to reject the null hypothesis.
O A. Fail to reject H, because the test statistic is not in the rejection region.
O B. Fail to reject Ho because the test statistic is in the rejection region.
OC. Reject Ho because the test statistic is in the rejection region.
O D. Reject H, because the test statistic is not in the rejection region.
(e) Interpret the decision in the context of the original claim.
O A. There is not sufficient evidence to reject the claim that the mean salary is not $22,275.
O B. There is sufficient evidence to reject the claim that the mean salary is $22,275.
O C. There is not sufficient evidence to reject the claim that the mean salary is $22,275.

Expert Solution

This question has been solved!
Explore an expertly crafted, step-by-step solution for a thorough understanding of key concepts.
This is a popular solution
Trending nowThis is a popular solution!
Step by stepSolved in 5 steps with 1 images

Knowledge Booster
Learn more about
Need a deep-dive on the concept behind this application? Look no further. Learn more about this topic, statistics and related others by exploring similar questions and additional content below.Similar questions
- An amusement park keeps track of the percentage of individuals with season passes according to age category. An independent tourist company would like to show that this distribution of age category for individuals buying season passes is different from what the amusement park claims. The tourist company randomly sampled 200 individuals entering the park with a season pass and recorded the number of individuals within each age category. Age Category Child (under 13 years old) Teen (13 to 19 years old) Adult (20 to 55 years old) Senior (56 years old and over) Number of Individuals 56 86 44 14 The tourist company will use the data to test the amusement park’s claim, which is reflected in the following null hypothesis. H0:pchild=0.23H0:pchild=0.23, pteen=0.45pteen=0.45, padult=0.20padult=0.20, and psenior=0.12psenior=0.12. What inference procedure will the company use to investigate whether or not the distribution of age category for individuals with season passes is…arrow_forwardIt is commonly believed that the mean body temperature of a healthy adult is 98.6° F. You are not entirely convinced. You believe that it is higher than 98.6° F. The temperatures for 12 randomly selected healthy adults are shown below. Assume that the distribution of the population is normal. 100.1, 96.8, 98.7, 100, 99.1, 98.3, 97.5, 100.9, 99.1, 100, 98.1, 100.1 What can be concluded at the a = 0.05 level of significance? a. For this study, we should use Select an answer b. The null and alternative hypotheses would be: Ho: ? Ha: Select an answer Select an answer c. The test statistic O Question Help: (please show your answer to 3 decimal places.) (Please show your answer to 4 decimal places.) d. The p-value = e. The p-value is a f. Based on this, we should Select an answer the null hypothesis. g. Thus, the final conclusion is that ... There is sufficient evidence to conclude that the population mean body temperature for healthy adults is higher than 98.6° F. There is not sufficient…arrow_forwardAccording to the Carnegie unit system, the recommended number of hours students should study per unit is 2. Are statistics students' study hours more than the recommended number of hours per unit? The data show the results of a survey of 11 statistics students who were asked how many hours per unit they studied. Assume a normal distribution for the population. 2, 2.9, 4.5, 0.7, 3.3, 4.5, 4.2, 1.2, 0.9, 1.8, 2.8 What can be concluded at the αα = 0.05 level of significance? The p-value = (Please show your answer to 4 decimal places. Based on this, we should Select an answer fail to reject accept reject the null hypothesis Thus, the final conclusion is that ... The data suggest the populaton mean is significantly more than 2 at αα = 0.05, so there is enough evidence to conclude that the population mean study time per unit for statistics students is more than 2. The data suggest the population mean is not significantly more than 2 at αα = 0.05, so there is enough evidence to…arrow_forward
- According to the National Automobile Dealers Association, the mean price for used cars is $10,192. A manager of a Kansas City used car dealership reviewed a sample of 50 recent used car sales at the dealership in an attempt to determine whether the population mean price for used cars at this particular dealership is below the national mean. The prices for the sample of 50 cars are shown in the file named UsedCars. 12400 10400 12100 10000 11000 8895 7675 9975 6350 10470 9895 11250 8795 12500 9340 10150 9200 9395 11000 10640 10000 7500 8000 10440 10200 10300 9740 9280 10930 8000 9000 7680 9400 10730 7350 12240 11970 8240 9910 10080 9440 8970 9500 10050 10130 11400 8500 7500 9090 10500 d. Report the critical value(s) associated with a 5% level of significance. What is your decision based on the critical value approach? (Reject Ho or fail to reject Ho?) e. Compute the p-value of the…arrow_forwardSixty-two percent of seniors attend a particular school in a school district. Assume 500 seniors within this school district are sampled. a. Can this distribution be approximated using the Normal model? Explain. b. Use the Normal approximation to estimate the probability that at least 290 senior students are enrolled at this particular school. c. Use the Normal model to estimate the probability that between 200 and 300 senior students who are sampled are enrolled at this particular school.arrow_forwardAccording to the Carnegie unit system, the recommended number of hours students should study per unit is 2. Are statistics students' study hours different from the recommended number of hours per unit? The data show the results of a survey of 16 statistics students who were asked how many hours per unit they studied. Assume a normal distribution for the population. 1.5, 2, 2.9, 3.8, 4.6, 1.1, 1.8, 2.6, 1.4, 2.8, 4.5, 1.2, 1, 0.7, 3, 1.2 What can be concluded at the αα = 0.05 level of significance? For this study, we should use Select an answer t-test for a population mean z-test for a population proportion The null and alternative hypotheses would be: H0:H0: ? μ p Select an answer < ≠ = > H1:H1: ? p μ Select an answer < ≠ = > The test statistic ? z t = (please show your answer to 3 decimal places.) The p-value = (Please show your answer to 4 decimal places.) The p-value is ? > ≤ αα Based on this, we should Select an answer reject fail to…arrow_forward
- According to the Carnegie unit system, the recommended number of hours students should study per unit is 2. Are statistics students' study hours more than the recommended number of hours per unit? The data show the results of a survey of 12 statistics students who were asked how many hours per unit they studied. Assume a normal distribution for the population. 1.2, 4.3, 4.5, 1.4, 1.5, 2.7, 1.8, 2.4, 1.3, 2, 2.2, 1.3 What can be concluded at the αα = 0.05 level of significance? A. Thus, the final conclusion is that ... The data suggest the populaton mean is significantly more than 2 at αα = 0.05, so there is enough evidence to conclude that the population mean study time per unit for statistics students is more than 2. The data suggest the population mean is not significantly more than 2 at αα = 0.05, so there is enough evidence to conclude that the population mean study time per unit for statistics students is equal to 2. The data suggest that the population mean study time per…arrow_forwardThe table below provides starting salary estimates for a number of health sciences occupations in Canada. Occupation Salary ($) Dietitian 49,000 Medical Technologist 47,000 EMT/Paramedic 54,000 Radiologic Technician 51,000 Dental Hygienist 58,000 Orthodontist 98,000 Optician 40,000 Radiation Therapist 55,000 Midwife 55,000 Massage Therapist 40,000 a. Calculate the mean salary using all the values. Round to the nearest cent b. Calculate the mean after removing the outlier(s) in the data set. Round to the nearest centarrow_forwardA boat capsized and sank in a lake. Based on an assumption of a mean weight of 142 lb, the boat was rated to carry 60 passengers (so the load limit was 8,520 lb). After the boat sank, the assumed mean weight for similar boats was changed from 142 lb to 171 lb. Complete parts a and b below. a. Assume that a similar boat is loaded with 60 passengers, and assume that the weights of people are normally distributed with a mean of 178.5 lb and a standard deviation of 36.9 lb. Find the probability that the boat is overloaded because the 60 passengers have a mean weight greater than 142 lb. The probability is 1.000. (Round to four decimal places as needed.) C.. b. The boat was later rated to carry only 13 passengers, and the load limit was changed to 2,223 lb. Find the probability that the boat is overloaded because the mean weight of the passengers is greater than 171 (so that their total weight is greater than the maximum capacity of 2,223 lb). The probability is. (Round to four decimal…arrow_forward
arrow_back_ios
arrow_forward_ios
Recommended textbooks for you
- MATLAB: An Introduction with ApplicationsStatisticsISBN:9781119256830Author:Amos GilatPublisher:John Wiley & Sons IncProbability and Statistics for Engineering and th...StatisticsISBN:9781305251809Author:Jay L. DevorePublisher:Cengage LearningStatistics for The Behavioral Sciences (MindTap C...StatisticsISBN:9781305504912Author:Frederick J Gravetter, Larry B. WallnauPublisher:Cengage Learning
- Elementary Statistics: Picturing the World (7th E...StatisticsISBN:9780134683416Author:Ron Larson, Betsy FarberPublisher:PEARSONThe Basic Practice of StatisticsStatisticsISBN:9781319042578Author:David S. Moore, William I. Notz, Michael A. FlignerPublisher:W. H. FreemanIntroduction to the Practice of StatisticsStatisticsISBN:9781319013387Author:David S. Moore, George P. McCabe, Bruce A. CraigPublisher:W. H. Freeman

MATLAB: An Introduction with Applications
Statistics
ISBN:9781119256830
Author:Amos Gilat
Publisher:John Wiley & Sons Inc

Probability and Statistics for Engineering and th...
Statistics
ISBN:9781305251809
Author:Jay L. Devore
Publisher:Cengage Learning

Statistics for The Behavioral Sciences (MindTap C...
Statistics
ISBN:9781305504912
Author:Frederick J Gravetter, Larry B. Wallnau
Publisher:Cengage Learning

Elementary Statistics: Picturing the World (7th E...
Statistics
ISBN:9780134683416
Author:Ron Larson, Betsy Farber
Publisher:PEARSON

The Basic Practice of Statistics
Statistics
ISBN:9781319042578
Author:David S. Moore, William I. Notz, Michael A. Fligner
Publisher:W. H. Freeman

Introduction to the Practice of Statistics
Statistics
ISBN:9781319013387
Author:David S. Moore, George P. McCabe, Bruce A. Craig
Publisher:W. H. Freeman