An engineering student wants to study the impact of temperature and humidity on yield. The following data was recorded by the student. S.N Temperature Humidity Yield 1 40 57 112 2 45 54 118 3 50 54 128 4 55 60 121 60 66 126 65 59 136 7 70 61 144 8 75 58 142 9 80 59 149 10 85 56 165 A: Simple Linear regression model between yield and temperature. a) Compute the correlation coefficient between yield and temperature. b) Find the equation of regression line between yields on temperature using least square method. c) Draw the scatter diagram between yield and temperature. d) Show the best fitted line on scatter diagram. e) What percentage of the variable yield can be explained by the variable temperature?
An engineering student wants to study the impact of temperature and humidity on yield. The following data was recorded by the student. S.N Temperature Humidity Yield 1 40 57 112 2 45 54 118 3 50 54 128 4 55 60 121 60 66 126 65 59 136 7 70 61 144 8 75 58 142 9 80 59 149 10 85 56 165 A: Simple Linear regression model between yield and temperature. a) Compute the correlation coefficient between yield and temperature. b) Find the equation of regression line between yields on temperature using least square method. c) Draw the scatter diagram between yield and temperature. d) Show the best fitted line on scatter diagram. e) What percentage of the variable yield can be explained by the variable temperature?

A First Course in Probability (10th Edition)
10th Edition
ISBN:9780134753119
Author:Sheldon Ross
Publisher:Sheldon Ross
Chapter1: Combinatorial Analysis
Section: Chapter Questions
Problem 1.1P: a. How many different 7-place license plates are possible if the first 2 places are for letters and...

Related questions
Question
I WANT full answer from b to e
answer without using excel or R studio
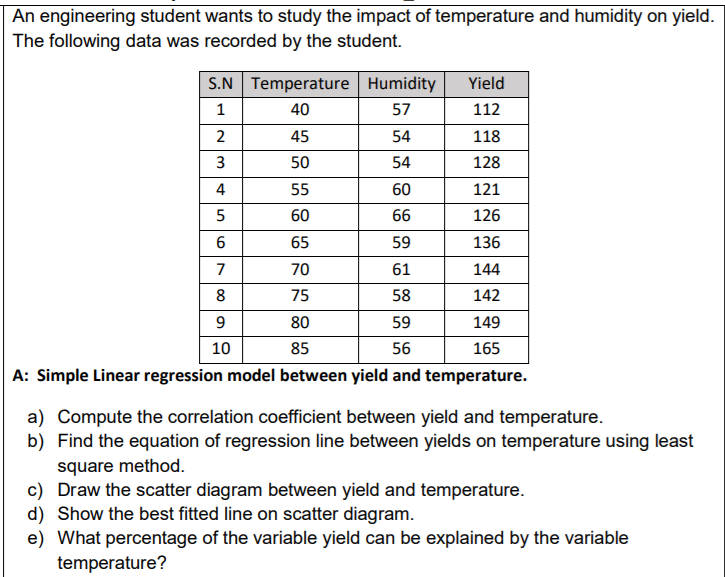
Transcribed Image Text:An engineering student wants to study the impact of temperature and humidity on yield.
The following data was recorded by the student.
S.N Temperature Humidity
Yield
1
40
57
112
2
45
54
118
3
50
54
128
4
55
60
121
60
66
126
65
59
136
7
70
61
144
8
75
58
142
9
80
59
149
10
85
56
165
A: Simple Linear regression model between yield and temperature.
a) Compute the correlation coefficient between yield and temperature.
b) Find the equation of regression line between yields on temperature using least
square method.
c) Draw the scatter diagram between yield and temperature.
d) Show the best fitted line on scatter diagram.
e) What percentage of the variable yield can be explained by the variable
temperature?
Expert Solution
This question has been solved!
Explore an expertly crafted, step-by-step solution for a thorough understanding of key concepts.

Step by step
Solved in 4 steps with 4 images

Recommended textbooks for you
A First Course in Probability (10th Edition)
Probability
ISBN:
9780134753119
Author:
Sheldon Ross
Publisher:
PEARSON

A First Course in Probability (10th Edition)
Probability
ISBN:
9780134753119
Author:
Sheldon Ross
Publisher:
PEARSON