An engineering student wants to study the impact of temperature and humidity on yield. The following data was recorded by the student. S.N Temperature Humidity Yield 1 40 57 112 45 54 118 50 54 128 4 55 60 121 60 66 126 6 65 59 136 7 70 61 144 8 75 58 142 80 59 149 10 85 56 165 A: Simple Linear regression model between yield and temperature. a) Compute the correlation coefficient between yleld and temperature. oy Ad the equation of Tegressioun line between yielde on tomporaturo using least square method. c) Draw the scatter diagram between yield and temperature. d) Show the best fitted line on scatter diagram. e) What percentage of the variable yield can be explained by the variable temnerature?
An engineering student wants to study the impact of temperature and humidity on yield. The following data was recorded by the student. S.N Temperature Humidity Yield 1 40 57 112 45 54 118 50 54 128 4 55 60 121 60 66 126 6 65 59 136 7 70 61 144 8 75 58 142 80 59 149 10 85 56 165 A: Simple Linear regression model between yield and temperature. a) Compute the correlation coefficient between yleld and temperature. oy Ad the equation of Tegressioun line between yielde on tomporaturo using least square method. c) Draw the scatter diagram between yield and temperature. d) Show the best fitted line on scatter diagram. e) What percentage of the variable yield can be explained by the variable temnerature?

College Algebra
7th Edition
ISBN:9781305115545
Author:James Stewart, Lothar Redlin, Saleem Watson
Publisher:James Stewart, Lothar Redlin, Saleem Watson
Chapter1: Equations And Graphs
Section: Chapter Questions
Problem 10T: Olympic Pole Vault The graph in Figure 7 indicates that in recent years the winning Olympic men’s...

Related questions
Question
Plz write clear solution from Qc to Qe with all steps.
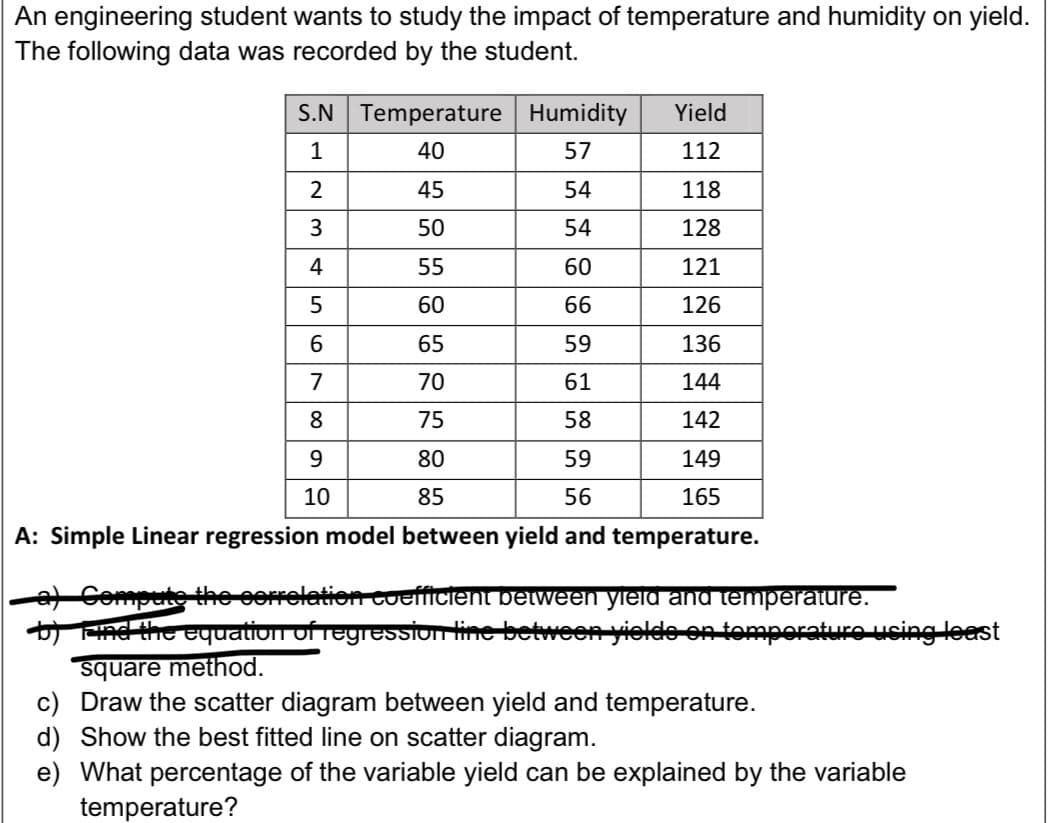
Transcribed Image Text:An engineering student wants to study the impact of temperature and humidity on yield.
The following data was recorded by the student.
S.N Temperature Humidity
Yield
1
40
57
112
45
54
118
3
50
54
128
4
55
60
121
5
60
66
126
6
65
59
136
7
70
61
144
8
75
58
142
9.
80
59
149
10
85
56
165
A: Simple Linear regression model between yield and temperature.
a Compute the correlation coUeficient between yield and temperature.
t ne the eyuation of regression line betweenyielde on tomporature using least
square method.
c) Draw the scatter diagram between yield and temperature.
d) Show the best fitted line on scatter diagram.
e) What percentage of the variable yield can be explained by the variable
temperature?
Expert Solution
This question has been solved!
Explore an expertly crafted, step-by-step solution for a thorough understanding of key concepts.

Step by step
Solved in 3 steps with 3 images

Recommended textbooks for you
College Algebra
Algebra
ISBN:
9781305115545
Author:
James Stewart, Lothar Redlin, Saleem Watson
Publisher:
Cengage Learning

Glencoe Algebra 1, Student Edition, 9780079039897…
Algebra
ISBN:
9780079039897
Author:
Carter
Publisher:
McGraw Hill
College Algebra
Algebra
ISBN:
9781305115545
Author:
James Stewart, Lothar Redlin, Saleem Watson
Publisher:
Cengage Learning
Glencoe Algebra 1, Student Edition, 9780079039897…
Algebra
ISBN:
9780079039897
Author:
Carter
Publisher:
McGraw Hill