An engineering student wants to study the impact of temperature and humidity on yield. The following data was recorded by the student. S.N Temperature Humidity Yield 40 57 112 45 54 118 3 50 54 128 4 55 60 121 5 60 66 126 65 59 136 7 70 61 144 8 75 58 142 9 80 59 149 10 85 56 165 A: Simple Linear regression model between yield and temperature. a) Compute the correlation coefficient between yield and temperature. b) Find the equation of regression line between yields on temperature using least square method. c) Draw the şcatter diagram between yield and temperature.
An engineering student wants to study the impact of temperature and humidity on yield. The following data was recorded by the student. S.N Temperature Humidity Yield 40 57 112 45 54 118 3 50 54 128 4 55 60 121 5 60 66 126 65 59 136 7 70 61 144 8 75 58 142 9 80 59 149 10 85 56 165 A: Simple Linear regression model between yield and temperature. a) Compute the correlation coefficient between yield and temperature. b) Find the equation of regression line between yields on temperature using least square method. c) Draw the şcatter diagram between yield and temperature.

Linear Algebra: A Modern Introduction
4th Edition
ISBN:9781285463247
Author:David Poole
Publisher:David Poole
Chapter7: Distance And Approximation
Section7.3: Least Squares Approximation
Problem 31EQ

Related questions
Question
Solve Qg, h , i.
Slove Qg and h without using Excel.
Qi using Rstudio.
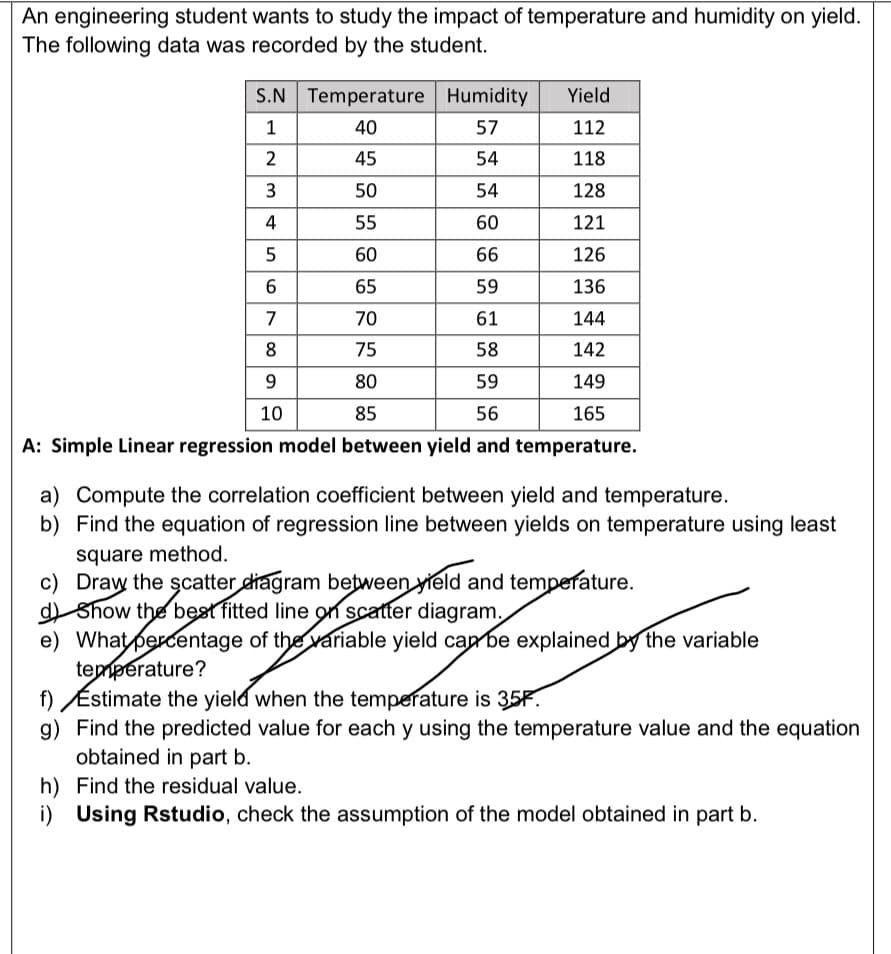
Transcribed Image Text:An engineering student wants to study the impact of temperature and humidity on yield.
The following data was recorded by the student.
S.N Temperature Humidity
Yield
40
57
112
45
54
118
3
50
54
128
4
55
60
121
60
66
126
65
59
136
7
70
61
144
8
75
58
142
9
80
59
149
10
85
56
165
A: Simple Linear regression model between yield and temperature.
a) Compute the correlation coefficient between yield and temperature.
b) Find the equation of regression line between yields on temperature using least
square method.
c) Draw the scatter diagram between yield and temperature.
Show the best fitted line on scatter diagram.
e) What percentage of the variable yield can be explained by the variable
temperature?
f) Estimate the yield when the temperature is 35F.
g) Find the predicted value for each y using the temperature value and the equation
obtained in part b.
h) Find the residual value.
i) Using Rstudio, check the assumption of the model obtained in part b.
Expert Solution
This question has been solved!
Explore an expertly crafted, step-by-step solution for a thorough understanding of key concepts.

Step by step
Solved in 2 steps with 1 images

Recommended textbooks for you
Linear Algebra: A Modern Introduction
Algebra
ISBN:
9781285463247
Author:
David Poole
Publisher:
Cengage Learning
Linear Algebra: A Modern Introduction
Algebra
ISBN:
9781285463247
Author:
David Poole
Publisher:
Cengage Learning