An experiment was performed to determine whether the annealing temperature of ductile iron affects its tensile strength. Five specimens were annealed at each of four temperatures. The tensile strength (in ksi) was measured for each. The results are presented in the following table. Temperature (*C) Sample Values 750 19.72 20.88 19.63 18.68 17.89 800 16.01 20.04 18.10 20.28 20.53 850 16.66 17.38 14.49 18.21 15.58 900 16.93 14.49 16.15 15.53 13.25 a Construct an ANOVA table. You may give a range for the P-value. b. Can you conclude that there are differences among the mean strengths?
An experiment was performed to determine whether the annealing temperature of ductile iron affects its tensile strength. Five specimens were annealed at each of four temperatures. The tensile strength (in ksi) was measured for each. The results are presented in the following table. Temperature (*C) Sample Values 750 19.72 20.88 19.63 18.68 17.89 800 16.01 20.04 18.10 20.28 20.53 850 16.66 17.38 14.49 18.21 15.58 900 16.93 14.49 16.15 15.53 13.25 a Construct an ANOVA table. You may give a range for the P-value. b. Can you conclude that there are differences among the mean strengths?

Glencoe Algebra 1, Student Edition, 9780079039897, 0079039898, 2018
18th Edition
ISBN:9780079039897
Author:Carter
Publisher:Carter
Chapter10: Statistics
Section10.1: Measures Of Center
Problem 9PPS

Related questions
Question
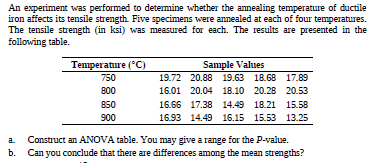
Transcribed Image Text:An experiment was performed to determine whether the annealing temperature of ductile
iron affects its tensile strength. Five specimens were annealed at each of four temperatures.
The tensile strength (in ksi) was measured for each. The results are presented in the
following table.
Temperature (*C)
Sample Values
750
19.72 20.88 19.63 18.68 17.89
800
16.01 20.04 18.10 20.28 20.53
850
16.66 17.38 14.49 18.21 15.58
900
16.93 14.49 16.15 15.53 13.25
a Construct an ANOVA table. You may give a range for the P-value.
b. Can you conclude that there are differences among the mean strengths?
Expert Solution
This question has been solved!
Explore an expertly crafted, step-by-step solution for a thorough understanding of key concepts.

This is a popular solution!

Trending now
This is a popular solution!

Step by step
Solved in 3 steps with 3 images

Recommended textbooks for you
Glencoe Algebra 1, Student Edition, 9780079039897…
Algebra
ISBN:
9780079039897
Author:
Carter
Publisher:
McGraw Hill
Glencoe Algebra 1, Student Edition, 9780079039897…
Algebra
ISBN:
9780079039897
Author:
Carter
Publisher:
McGraw Hill