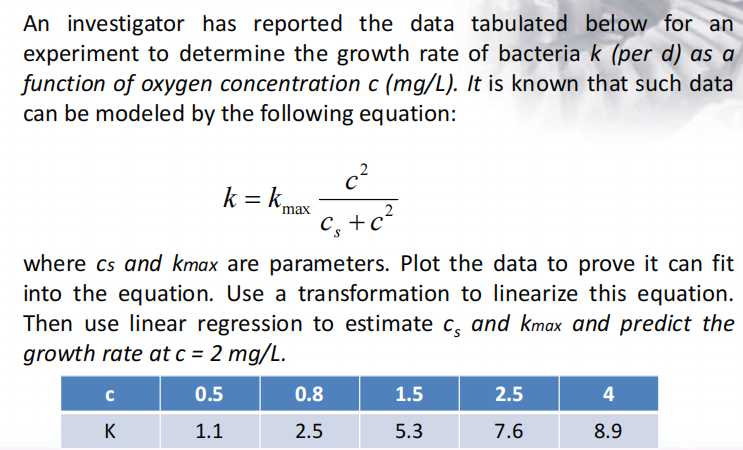
An investigator has reported the data tabulated below for an experiment to determine the growth rate of bacteria k (per d) as a function of oxygen concentration c (mg/L). It is known that such data can be modeled by the following equation: c² k = kmax C, +c? where cs and kmax are parameters. Plot the data to prove it can fit into the equation. Use a transformation to linearize this equation. Then use linear regression to estimate c, and kmax and predict the growth rate at c = 2 mg/L. %3D
An investigator has reported the data tabulated below for an experiment to determine the growth rate of bacteria k (per d) as a function of oxygen concentration c (mg/L). It is known that such data can be modeled by the following equation: c² k = kmax C, +c? where cs and kmax are parameters. Plot the data to prove it can fit into the equation. Use a transformation to linearize this equation. Then use linear regression to estimate c, and kmax and predict the growth rate at c = 2 mg/L. %3D

Algebra & Trigonometry with Analytic Geometry
13th Edition
ISBN:9781133382119
Author:Swokowski
Publisher:Swokowski
Chapter7: Analytic Trigonometry
Section7.6: The Inverse Trigonometric Functions
Problem 93E

Related questions
Question
Transcribed Image Text:An investigator has reported the data tabulated below for an
experiment to determine the growth rate of bacteria k (per d) as a
function of oxygen concentration c (mg/L). It is known that such data
can be modeled by the following equation:
c²
k = kme
max
C, +c?
where cs and kmax are parameters. Plot the data to prove it can fit
into the equation. Use a transformation to linearize this equation.
Then use linear regression to estimate c, and kmax and predict the
growth rate at c = 2 mg/L.
C
0.5
0.8
1.5
2.5
4
K
1.1
2.5
5.3
7.6
8.9
Expert Solution
This question has been solved!
Explore an expertly crafted, step-by-step solution for a thorough understanding of key concepts.

This is a popular solution!

Trending now
This is a popular solution!

Step by step
Solved in 6 steps with 6 images

Recommended textbooks for you
Algebra & Trigonometry with Analytic Geometry
Algebra
ISBN:
9781133382119
Author:
Swokowski
Publisher:
Cengage
Algebra & Trigonometry with Analytic Geometry
Algebra
ISBN:
9781133382119
Author:
Swokowski
Publisher:
Cengage