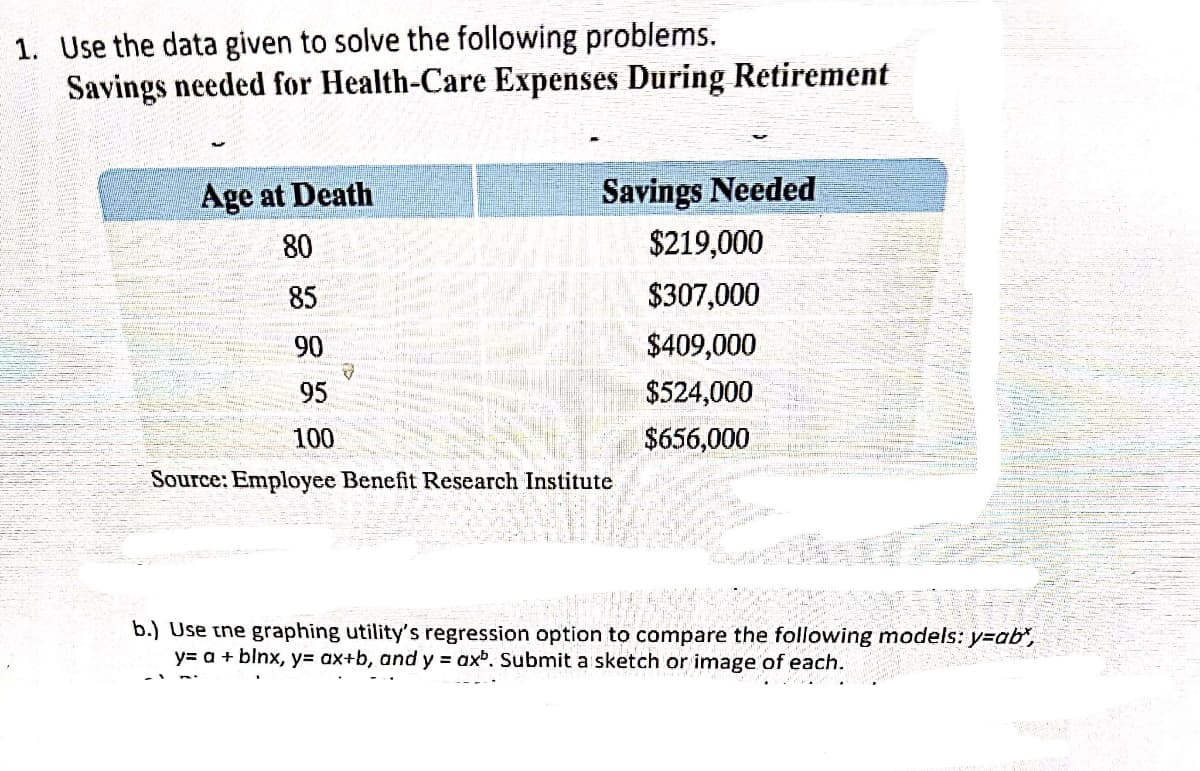
Use the data given to solve the following problems. Savings needed for Health-Care Expenses During Retirement Age at Death Savings Needed 80 $219,000 85 $307,000 90 $409,000 95 $524,000 100 $656,000 Source: Employee Benefit Research Institute b.) Use tne graphing utility's regression option to compare the following models: y=ab", y= a + blnx, y= ax+b, and y = axb. Submit a sketch or image of each.


Q: The table below gives the retail sale of electricity (in billions of kilowatt-hours) for the…
A:
Q: The table below shows the number of state-registered automatic weapons and the murder rate for…
A: x y xy x2 11.3 13.8 155.94 127.69 8.4 11 92.4 70.56 7.2 10.4 74.88 51.84 3.9 7.3…
Q: A set of X and Y scores Mx=4, SSx=10, My=5, SSy=40, SP=20. What is the regression equation for…
A: Given that xbar = 4, SSx = 10, ybar = 5, SSy = 40, SSp = 20.The equation of a regression line is…
Q: The table below shows the number of state-registered automatic weapons and the murder rate for…
A:
Q: Finally, the researcher is interested in examining the regression model for knowledge, attitude and…
A:
Q: houschold a and their monlhly expenditure y. A sample from the study is shown below. 1 3000 2 4000 3…
A: In this case, monthly expenditure is dependent variable y and number of family members in the…
Q: 1. Use the data given to solve the following problems. Savings needed for Health-Care Expenses…
A:
Q: The figures for Triple A's revenue and the amount of money earned by wage earners in Albany - NY has…
A: The given data is, X Y 3 6.5 4 8.0 5 8.5 6 5.5 2 4.0 5 9.0 So,
Q: Given the data in the table below for the dependent variable Y and independent variables X1, X2, and…
A: Since you have posted a question with multiple sub-parts, we will solve first three subparts for…
Q: The percentage of female high school graduates who enrolled in college is given in the table below.…
A: NOTE: Refresh your page if you can't see any equations. . use the calculator to find the cubic…
Q: The table below shows the number of state-registered automatic weapons and the murder rate for…
A: From the provided information, y = 0.85x + 4.02 Here x = thousands of automatic weapons y = murders…
Q: The table below shows the number of state-registered automatic weapons and the murder rate for…
A: Carefully examine the given table and the given equation to help the solve the given problem
Q: he table shows the age of a painting (x) in years, and its estimated dollar value (y). x2 y 1,200…
A:
Q: A number of investigations have focused on the problem of assessing weights that can be lifted in a…
A: As per our guidelines, we are allowed to answer first three sub-parts only. Thanks Given…
Q: The table below shows the number of state-registered automatic weapons and the murder rate for…
A: The line of regression is: y=0.83x+4.09 where, x = thousands of automatic weapons y = murders per…
Q: consider the following sample of production volumes and total cost data for manuracturing operation.…
A: The null hypothesis in simple linear regression is that the slope is zero and the alternate…
Q: The table contains price-demand and total cost data for the production of extreme-cold sleeping…
A: Hello! As you have posted more than 3 sub parts, we are answering the first 3 sub-parts. In case…
Q: The table below shows the number of state-registered automatic weapons and the murder rate for…
A: The independent variable is thousands of automatic weapons. The dependent variable is murders per…
Q: The percentage of female high school graduates who enrolled in college is given in the table below.…
A: The instantaneous rate of change of fx at x=a is f'(a). The cubic regression technique uses a…
Q: the table below shows the number of state-registered automatic weapons and the murder rate for…
A:
Q: The manufacturer of Beanie Baby dolls used quarterly price data for 2005 / 2013 /V(1-1, 36) and the…
A: Statisticians use the time-series regression analysis to predict future values.
Q: A shoe store developed the following estimated regression equation relating sales to inventory…
A:
Q: The following are data on the average weekly profits(in $1,000) of five restaurants, their seating…
A: Software procedure for regression in EXCEL. Enter the given data in EXCEL sheet. Go to Data >…
Q: In an article in the American Journal or / Clinical Pathology, by Metz et al. (A-4) published the…
A: Answer:----. Date:----11/10/2021
Q: City Room Rate ($) Entertainment ($) Boston 148 161 Denver 96 105 Nashville 91 101 New…
A: The given estimated regression equation is y-hat = 17.49 + 1.0334x and the value of SSE is…
Q: A professor in a university polled a dozen colleagues about the number of professional meetings they…
A: The independent variable is the number of professional meetings they attended in the past five…
Q: The figures for Triple A's revenue and the amount of money earned by wage earners in Albany - NY has…
A: The required table for the given data can be formed as follows Y X (X-X_bar)^2 (Y-Y)(X-X) 6.5…
Q: Consider the following data on x = weight (pounds) and y = price ($) for 10 road-racing bikes. Brand…
A: Given The following data on x=weight and y=price for 10 road racing bikes is given weight (x)…
Q: 1- Find attached the following data: Year 1990 1991 1992 1993 1994 Sales 5 3 10 - Calculate the…
A: Formulas and function in Excel.
Q: In an study similar to the one in Exercise 3, the relative humidity and ozone levels were measured…
A: a. From the output, Slope =-0.13468 ≈ -0.135 b. The sample size is 120. The degrees of…
Q: The following data give the percentage of women working in five companies in the retail and trade…
A:
Q: The table below shows the number of state-registered automatic weapons and the murder rate for…
A:
Q: The table below shows the number of state-registered automatic weapons and the murder rate for…
A: Given , x = thousands of automatic weapons y = Murders per 100,000 Given regression equation , y…
Q: A shoe store developed the following estimated regression equation relating sales to inventory…
A: Given : Total independent variables = 2 Degrees of freedom of regression = dfregression = 2 Total…
Q: is the wholesale price (in dollars) of a treadmill for an annual demand of z treadmills, and C is…
A:
Q: Consider the following data on x = weight (pounds) and y = price (S) for 10 road-racing bikes. Brand…
A:
Q: The table below shows the number of state-registered automatic weapons and the murder rate for…
A:
Q: Given the following information regarding a regression model with Y as dependent variable and X as…
A: The data given in the problem will help in calculating the standard errors of the regression model.…
Q: 1. Use the data given to solve the following problems. Savings needed for Health-Care Expenses…
A: Note:-Since you have posted a question with multiple sub-parts, we will solve first three sub-parts…
Q: Use the data given to solve the following problems. Savings needed for Health-Care Expenses During…
A: Given data: Age at Death Savings Needed 80 $219,000 85 $307,000 90 $409,000 95 $524,000…
Q: linear regression data for two students walking in front of a motion sensor: Bob’s walk d = 0.75t +…
A:
Q: Brand A D C --0 P G H 1 3 10. 0140 H₂A₁D data on Weight H₂O ONA 20 H₂ P₁ <0 H₁₁0 16.1 14.9 15.9…
A: Solution: Given information: n= 10 observation k= 1 independent variable SSE= 6833947.38 Sum of…
Q: The table below shows the number of state-registered automatic weapons and the murder rate for…
A:
Q: To fit a simple linear regression model to the data and to provide its equation (d = a*t + b), along…
A: To fit a simple linear regression line we first define the independent and the dependent variables.…
Q: The table below shows the number of state-registered automatic weapons and the murder rate for…
A: The regression analysis is conducted here by using EXCEL. The software procedure is given below:…
Q: The table below shows the number of state-registered automatic weapons and the murder rate for…
A: Given, x y 11.9 14 8.4 11.1 6.8 9.6 3.8 7.3 2.9 6.7 2.7 6.5 2.6 6.3 0.5 4.7
Q: A group of Maternal and Child Health public health practitioners are interested in the relationship…
A: The below are the answers.
Q: A set of X and Y scores has MX = 4, SSX = 10, MY = 5, SSY = 40, and SP = 20. Which is the regression…
A: The given values are MX=4,SSX=10,MY=5,SSY=40 and SP=20.
Q: The following data give the percentage of women working in five companies in the retail and trade…
A: Linear regression equation is a equation that is used to predict the relation between two variables…
Q: A set of X and Y scores has Mx=4, SSx=10, My=5, SSy = 40, and SP=20. What is the regression equation…
A: From the given information, Mx=4, SSx=10, My=5, SSy=40 and SP=20.

Step by step
Solved in 2 steps with 6 images

- Find the equation of the regression line for the following data set. x 1 2 3 y 0 3 4Olympic Pole Vault The graph in Figure 7 indicates that in recent years the winning Olympic men’s pole vault height has fallen below the value predicted by the regression line in Example 2. This might have occurred because when the pole vault was a new event there was much room for improvement in vaulters’ performances, whereas now even the best training can produce only incremental advances. Let’s see whether concentrating on more recent results gives a better predictor of future records. (a) Use the data in Table 2 (page 176) to complete the table of winning pole vault heights shown in the margin. (Note that we are using x=0 to correspond to the year 1972, where this restricted data set begins.) (b) Find the regression line for the data in part ‚(a). (c) Plot the data and the regression line on the same axes. Does the regression line seem to provide a good model for the data? (d) What does the regression line predict as the winning pole vault height for the 2012 Olympics? Compare this predicted value to the actual 2012 winning height of 5.97 m, as described on page 177. Has this new regression line provided a better prediction than the line in Example 2?Consider the following linear regression model that relates income per capita in thousand dollars of a country i (GDP P Ci), with its percentage of the population in the agricultural sector (P Ai): Model : GDP P Ci = β0 + β1P Ai + ui (a) Explain in words how to interpret parameters β0 and β1. What sign do you think these parameters might have? Explain. (b) Draw the (population) regression line associated with this model assuming that parameters β0 and β1 have the sign you have indicated in answering question (2a). Explain the meaning of this regression line.
- The director of marketing at Vanguard Corporation believes that sales of the company's Bright Side laundry detergent (S) are related to Vanguard's own advertising expenditure (A), as well as the combined advertising expenditures of its three biggest rival detergent (R). The marketing director collects 36 weekly observations on S, A and R to estimate the following multiple regression equation: S = a + bA + cR .where, S, A, and R are measured in dollars per week. Vanguard's marketing director is comfortable using parameter estimates that are statistically significant at the 10% level or better.DEPENDENT VARIABLE: S R-SQUARE F-RATIO P-VALUE ON FOBSERVATIONS: 36 0.2247 4.781 0.0150VARIABLE PARAMETER STANDARD T-RATIO P-VALUE ESTIMATE ERRORINTERCEPT 175086.0 63821.0 2.74 0.0098A 0.8550 0.3250…The following table shows the annual number of PhD graduates in a country in various fields. NaturalSciences Engineering SocialSciences Education 1990 70 10 60 30 1995 130 40 120 50 2000 330 130 280 140 2005 490 370 460 210 2010 590 550 830 520 2012 690 590 1,000 900 (a) With x = the number of social science doctorates and y = the number of education doctorates, use technology to obtain the regression equation. (Round coefficients to three significant digits.) y(x) = Graph the associated points and regression line. (b) What does the slope tell you about the relationship between the number of social science doctorates and the number of education doctorates? The slope tells us the increase in the number of education doctorates for each additional social science doctorate.The slope tells us the decrease in the number of education doctorates for each additional social science doctorate. The slope tells us the increase in the number…The director of marketing at Vanguard Corporation believes that sales of the company's Bright Side laundry detergent (S) are related to Vanguard's own advertising expenditure (A), as well as the combined advertising expenditures of its three biggest rival detergents (R). The marketing director collects 36 weekly observations on S, A, and R to estimate the following multiple regression equation: S = a + bA + cR where S, A, and R are measured in dollars per week. Vanguard's marketing director is comfortable using parameter estimates that are statistically significant at the 10 percent level or better. a. What sign does the marketing director expect a, b, and c to have? b. Interpret the coefficeints a, b, and c. The regression output from the computer is as follows: c. Does Vanguard's advertising expenditure have a statistically significant effect on the sales of Bright Side detergent? Explain, using the appropriate…
- The director of marketing at Vanguard Corporation believes that sales of the company’s Bright Side laundry detergent (S) are related to Vanguard’s own advertising expenditure (A), as well as the combined advertising expenditures of its three biggest rival detergents (R). The marketing director collects 36 weekly observations on S, A, and R to estimate the following multiple regression equation: S = a + bA + cR. where S, A, and R are measured in dollars per week. Vanguard’s marketing director is comfortable using parameter estimates that are statistically significant at the 10 percent level or better. What sign does the marketing director expect a, b, and c to have? Interpret the coefficients a, b, and c. The regression output from the computer is as follows: 3- Does Vanguard’s advertising expenditure have a statistically significant effect on the sales of Bright Side detergent? Explain, using the appropriate p-value. 4- Does advertising by its three largest rivals affect sales of…The director of marketing at Vanguard Corporation believes that sales of the company's Bright Side laundry detergent (S) are related to Vanguard's own advertising expenditure (A), as well as the combined advertising expenditures of its three biggest rival detergents (R). The marketing director collects 36 weekly observations on S, A, and R to estimate the following multiple regression equation: S = a + bA + cR where S, A, and R are measured in dollars per week. Vanguard's marketing director is comfortable using parameter estimates that are statistically significant at the 10 percent level or better. a. What sign does the marketing director expect a, b, and c to have? b. Interpret the coefficeints a, b, and c. The regression output from the computer is as follows: c. Does Vanguard's advertising expenditure have a statistically significant effect on the sales of Bright Side detergent? Explain, using the appropriate…he following table shows the annual number of PhD graduates in a country in various fields. NaturalSciences Engineering SocialSciences Education 1990 70 10 60 30 1995 130 40 100 50 2000 330 130 280 140 2005 490 370 460 210 2010 590 550 830 520 2012 690 590 1,000 900 (a)With x = the number of social science doctorates and y = the number of education doctorates, use technology to obtain the regression equation. (Round coefficients to three significant digits.) y(x) = Use technology to obtain the coefficient of correlation r. (Round your answer to three decimal places.) r =
- The following table shows the annual number of PhD graduates in a country in various fields. NaturalSciences Engineering SocialSciences Education 1990 70 10 70 30 1995 130 40 110 50 2000 330 130 280 140 2005 490 370 460 210 2010 590 550 830 520 2012 690 590 1,000 900 (a) With x = the number of social science doctorates and y = the number of education doctorates, use technology to obtain the regression equation. (Round coefficients to three significant digits.) y(x) = Graph the associated points and regression line. (b) What does the slope tell you about the relationship between the number of social science doctorates and the number of education doctorates? The slope tells us the increase in the number of social science doctorates for each additional education doctorate.The slope tells us the increase in the number of education doctorates for each additional social science doctorate. The slope tells us the decrease in the number…The following table shows the annual number of PhD graduates in a country in various fields. NaturalSciences Engineering SocialSciences Education 1990 70 10 60 30 1995 130 40 100 50 2000 330 130 280 120 2005 490 370 460 210 2010 590 550 830 520 2012 690 590 1,000 900 (a) With x = the number of social science doctorates and y = the number of education doctorates, use technology to obtain the regression equation. (Round coefficients to three significant digits.) y(x) = What does the slope tell you about the relationship between the number of social science doctorates and the number of education doctorates? The slope tells us the increase in the number of education doctorates for each additional social science doctorate. The slope tells us the decrease in the number of social science doctorates for each additional education doctorate. The slope tells us the increase in the number of social science doctorates for each additional education doctorate.…The following table shows the annual number of PhD graduates in a country in various fields. NaturalSciences Engineering SocialSciences Education 1990 70 10 60 30 1995 130 40 100 50 2000 330 130 280 140 2005 490 370 460 210 2010 590 550 830 520 2012 690 590 1,000 900 (a) With x = the number of social science doctorates and y = the number of education doctorates, use technology to obtain the regression equation. (Round coefficients to three significant digits.) y(x) =

