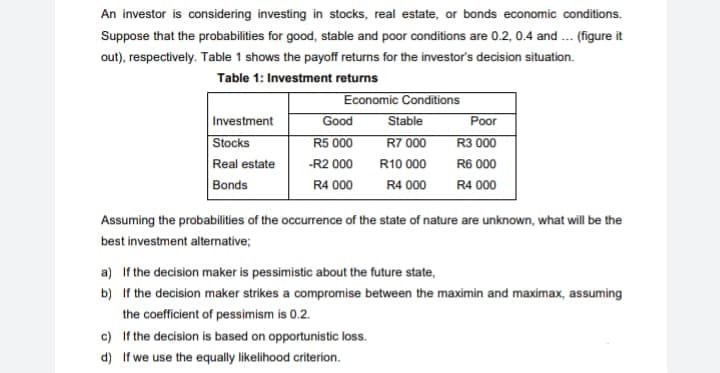
An investor is considering investing in stocks, real estate, or bonds economic conditions. Suppose that the probabilities for good, stable and poor conditions are 0.2, 0.4 and ... (figure it out), respectively. Table 1 shows the payoff returns for the investor's decision situation. Table 1: Investment returns Investment Stocks Real estate Bonds Economic Conditions Good R5 000 -R2 000 R4 000 Stable R7 000 R10 000 R4 000 Poor R3 000 R6 000 R4 000 Assuming the probabilities of the occurrence of the state of nature are unknown, what will be the best investment alternative; c) If the decision is based on opportunistic loss. d) If we use the equally likelihood criterion. a) If the decision maker is pessimistic about the future state, b) If the decision maker strikes a compromise between the maximin and maximax, assuming the coefficient of pessimism is 0.2.


Q: How can Foxconn improve its ethical decision-making and corporate social responsibility?
A: By enhancing the social and environmental circumstances in which it works, a firm demonstrates its…
Q: Which projects should be selected? Project 1 will Project 2 will Project 3 will Project 4 will…
A: Here, the objective function is maximizing the total net present value for all the projects, the…
Q: The Hills County, Michigan, superintendent of education is responsible for assigning students to the…
A: Find the Transportation table below: Transportation table Sector Distance to School School…
Q: Instruction: 1. Solve the problem on Linear Programming Model Using (a) Graphical Method, and (b)…
A: Linear programming is a mathematical technique that is also used in operations management…
Q: The are different project management tools and techniques to assist the project manager to complete…
A: Project management is the management in which different types of knowledge and skills are needed to…
Q: The table below shows the sales figures for a brand of shoe over the last 12 months. Months Sales…
A: (i) (ii)
Q: Imagine that you are entering a fast-food restaurant. Your choices are either to eat inside or order…
A: Fast food restaurant is a part of the service industry where services are delivered up to customers'…
Q: Which of the following is likely to be data rather than information? a. Top 3 suppliers with the…
A: Data: Data is a collection of unprocessed, raw facts and information, such as text, observations,…
Q: What skills do you think must be available when implementing the project?
A: Project implementation is the significant stage to ensuring that processes & plans are…
Q: Tyler Apiaries sells bees and beekeeping supplies. Bees (including a queen) are shipped in special…
A: Target weight of the package = 12 Kgs Historically, Tyler's shipments have weighted on an average=…
Q: a) The correct precedence relationship with one of the possible assignment of tasks to workstations…
A: Project schedule helps in calculating different values all related to the production cycle like the…
Q: Problem 12-5 (Algo) Garden Varlety Flower Shop uses 810 clay pots a month. The pots are purchased at…
A: Given data Monthly Demand (d) = 810 clay pots Annual demand (D) = Monthly Demand× No. of months in a…
Q: Max Z = 3X1 + 4X2 Sub to: X1 + X2 ≤ 20 2X1 + 3X2 ≤ 50 And X1, X2 ≥ 0 (SOLVE MANUALLY USING…
A: Linear programming is a mathematical technique that is also used in operations management…
Q: a) What is the economic order quantity? 306 units (round your response to the nearest whole number).…
A: EOQ stands for economic order quantity. It is a company's optimal order quantity that undervalues…
Q: What would be the product life cycle of iphone 6s in operation managent
A: The term Product Life Cycle usually refers to the various kinds of phases or levels that a…
Q: A manager wishes to build a 3-sigma range chart for a process. The sample size is five, the mean of…
A: Given x bar =45 r bar = 7.90 D3 = 0 D4 = 2.115
Q: K Race One Motors is an Indonesian car manufacturer. At its largest manufacturing facility, in…
A: Economic order quantity is an order quantity that use to define the optimal quantity of orders to…
Q: Activities' estimated duration and the time intervals at which the actual progress is analyzed…
A: An activity's estimated duration can be defined as the approximated time that will be taken by a…
Q: Describe the seven work processes of how project time management can be divided as defined by the…
A: The ability to keep things on schedule is also crucial while leading a project. As such, it is seen…
Q: Consider the following dual problem Minimize Z = 7x₁ + 2x₂ + 5x3+4x4 subject to 2x₁ + 4x₂ + 7x3 + x4…
A: Min Z = 7 x1 + 2 x2 + 5 x3 + 4 x4 subject to 2 x1 +…
Q: Ram Roy's firm has developed the following supply, demand, cost, and inventory data Period 1 2 3…
A: Find the Calculation methods below: Given details: Period 1 Period 2 Period 3 Demand 40 60…
Q: For which items should we keep our own inventory?
A: Inventory refers to good, merchandise and materials that are held by business for selling in the…
Q: ii Calculate the maximum level of inventory
A: The formula for finding the maximum level of inventory = Re-order point/level + Re-order qty - (min…
Q: We have demand for a product with 1500 units/month. The vendor offers quantity discounted method for…
A: Annual demand (D) = 1500×12=18000 Units Order cost (S) = $10 + $3 = $13 per order Warehouse rent fee…
Q: Discuss the role of the Literature Review in a scholarly article. What is it? Why are writing…
A: The goal of a literature review is to increase understanding of current research and conversations…
Q: David Polston prints up T-shirts to be sold at local concerts. The T-shirts sell for $18.90 each but…
A: Given, Selling price SP= $18.9 Cost price CP= $4.6 Salvage value V = $4.5 Mean m = 170 Standard…
Q: Southeastern Bell stocks a certain switch connector at its central warehouse for supplying field…
A: Economic order quantity is the ideal quality that company orders to meet the customers' demand…
Q: Describe and discuss the characteristics and benefits that Electronic Data Interchange (EDI) has to…
A: Electronic Data Interchange (EDI) is a process that enables businesses to communicate messages to…
Q: 2. Consider the transportation problem having the following parameter table (M is a big positive…
A: NWCM rule means assignment from top left corner first. Let M = 50 (randomly taken positive…
Q: 4. Organic Grains LLC uses statistical process control to ensure that its health-conscious,…
A: Given data:
Q: a) The cycle time for the production of a PDA= 20 seconds (round your response to two decimal…
A: Project schedule helps in calculating different values all related to the production cycle like the…
Q: Advise the new junior salesman as to what globalisation is.
A: Globalization is basically everything carried out to arrive at business sectors with various…
Q: Given the following due dates and processing times (in days) for 3 jobs. Each job must go through 3…
A: Job sequencing is the process of assigning jobs to people or machines in the most efficient way.…
Q: Ram Roy's firm has developed the following supply, demand, cost, and inventory data. Supply…
A: The transportation method is a special kind of linear programming. It is used to determine the…
Q: d) What percentage of time will the facility be producing components?% (enter your response as a…
A: Production is the process in which inputs are combined to have the required output. It includes a…
Q: A passenger aircraft is composed of several millions of parts and requires thousands of persons to…
A: The primary distinction between creating an airplane, a bridge, or software is that when we create…
Q: Daniel Tracy, owner of Martin Manufacturing, must expand by building a new factory. The search for a…
A: Initial calculation:
Q: You are an experienced machinist with a small tool shop. You have been asked to submit a bid to…
A: Find the Calculation methods below: Required time (Tn) = T1nbn - Unit numberT1 - Time Taken for…
Q: onstraints and apply each to a simulation/assumption of a constraint impacting Jag
A: The idea of constraints is a technique for figuring out what's preventing your project from moving…
Q: Solve using dual simplex method Maximize Xo = X1 + 2x2-3x3 + 4X4 -X1 + 2x2 + x3 3x4 = 5 6X1 +…
A: Problem is Max Z = x1 + 2 x2 - 3 x3 + 4 x4 subject to - x1 + 2 x2 + x3 -…
Q: A regional bank training center has the physical ability to handle 1,300 participants. However,…
A: Design Capacity of training center = 1300 participants Effective capacity = 1100 participants Actual…
Q: Calculate the average inventory
A: EOQ stands for economic order quantity. It is a company's optimal order quantity that undervalues…
Q: Jan orders 100 rulers from Depot Office Supplies for which she pays the sales price of $100 in…
A: A formal request to halt a check or payment that has not yet been completed is known as a stop…
Q: Briefly elaborate the importance of Quality control department for the national and international…
A: Quality is an important factor with regards to any item or service. With the high market…
Q: Your firm would like to purchase a very important piece of equipment from a supplier in South…
A: “Since you have asked multiple questions, we will solve the first question for you. If you want any…
Q: Quality control in a factory pulls 40 parts with paint, packaging, or electronic defects from an…
A: Quality control in a factory pulls 40 parts with paint, packaging, or electronic defects from an…
Q: Problem 12-3 (Static) A large bakery buys flour In 25-pound bags. The bakery uses an average of…
A: Annual Demand = D = 1215 bags Ordering Cost = S = $10 Annual carrying cost per bag = $75
Q: Describe a service experience where operations related issues resulted in an service product that…
A: In an organization, no department can work in isolation to other departments. Every department is…
Q: If Amazon had ships to transport cargo, where in the shipping cycle would they take risks and maybe…
A: The shipping cycle is a concept that explains the response of shipping companies to supply and…
Q: Compensation and Benefits Administration You just finished analysing information for the current…
A: Part a) The word "compensation" is related to the management of human resources. A compensation…


Trending now
This is a popular solution!

Step by step
Solved in 5 steps with 8 images

- Suppose you currently have a portfolio of three stocks, A, B, and C. You own 500 shares of A, 300 of B, and 1000 of C. The current share prices are 42.76, 81.33, and, 58.22, respectively. You plan to hold this portfolio for at least a year. During the coming year, economists have predicted that the national economy will be awful, stable, or great with probabilities 0.2, 0.5, and 0.3. Given the state of the economy, the returns (one-year percentage changes) of the three stocks are independent and normally distributed. However, the means and standard deviations of these returns depend on the state of the economy, as indicated in the file P11_23.xlsx. a. Use @RISK to simulate the value of the portfolio and the portfolio return in the next year. How likely is it that you will have a negative return? How likely is it that you will have a return of at least 25%? b. Suppose you had a crystal ball where you could predict the state of the economy with certainty. The stock returns would still be uncertain, but you would know whether your means and standard deviations come from row 6, 7, or 8 of the P11_23.xlsx file. If you learn, with certainty, that the economy is going to be great in the next year, run the appropriate simulation to answer the same questions as in part a. Repeat this if you learn that the economy is going to be awful. How do these results compare with those in part a?An automobile manufacturer is considering whether to introduce a new model called the Racer. The profitability of the Racer depends on the following factors: The fixed cost of developing the Racer is triangularly distributed with parameters 3, 4, and 5, all in billions. Year 1 sales are normally distributed with mean 200,000 and standard deviation 50,000. Year 2 sales are normally distributed with mean equal to actual year 1 sales and standard deviation 50,000. Year 3 sales are normally distributed with mean equal to actual year 2 sales and standard deviation 50,000. The selling price in year 1 is 25,000. The year 2 selling price will be 1.05[year 1 price + 50 (% diff1)] where % diff1 is the number of percentage points by which actual year 1 sales differ from expected year 1 sales. The 1.05 factor accounts for inflation. For example, if the year 1 sales figure is 180,000, which is 10 percentage points below the expected year 1 sales, then the year 2 price will be 1.05[25,000 + 50( 10)] = 25,725. Similarly, the year 3 price will be 1.05[year 2 price + 50(% diff2)] where % diff2 is the percentage by which actual year 2 sales differ from expected year 2 sales. The variable cost in year 1 is triangularly distributed with parameters 10,000, 12,000, and 15,000, and it is assumed to increase by 5% each year. Your goal is to estimate the NPV of the new car during its first three years. Assume that the company is able to produce exactly as many cars as it can sell. Also, assume that cash flows are discounted at 10%. Simulate 1000 trials to estimate the mean and standard deviation of the NPV for the first three years of sales. Also, determine an interval such that you are 95% certain that the NPV of the Racer during its first three years of operation will be within this interval.Suppose you begin year 1 with 5000. At the beginning of each year, you put half of your money under a mattress and invest the other half in Whitewater stock. During each year, there is a 40% chance that the Whitewater stock will double, and there is a 60% chance that you will lose half of your investment. To illustrate, if the stock doubles during the first year, you will have 3750 under the mattress and 3750 invested in Whitewater during year 2. You want to estimate your annual return over a 30-year period. If you end with F dollars, your annual return is (F/5000)1/30 1. For example, if you end with 100,000, your annual return is 201/30 1 = 0.105, or 10.5%. Run 1000 replications of an appropriate simulation. Based on the results, you can be 95% certain that your annual return will be between which two values?
- You want to take out a 450,000 loan on a 20-year mortgage with end-of-month payments. The annual rate of interest is 3%. Twenty years from now, you will need to make a 50,000 ending balloon payment. Because you expect your income to increase, you want to structure the loan so at the beginning of each year, your monthly payments increase by 2%. a. Determine the amount of each years monthly payment. You should use a lookup table to look up each years monthly payment and to look up the year based on the month (e.g., month 13 is year 2, etc.). b. Suppose payment each month is to be the same, and there is no balloon payment. Show that the monthly payment you can calculate from your spreadsheet matches the value given by the Excel PMT function PMT(0.03/12,240, 450000,0,0).Based on Babich (1992). Suppose that each week each of 300 families buys a gallon of orange juice from company A, B, or C. Let pA denote the probability that a gallon produced by company A is of unsatisfactory quality, and define pB and pC similarly for companies B and C. If the last gallon of juice purchased by a family is satisfactory, the next week they will purchase a gallon of juice from the same company. If the last gallon of juice purchased by a family is not satisfactory, the family will purchase a gallon from a competitor. Consider a week in which A families have purchased juice A, B families have purchased juice B, and C families have purchased juice C. Assume that families that switch brands during a period are allocated to the remaining brands in a manner that is proportional to the current market shares of the other brands. For example, if a customer switches from brand A, there is probability B/(B + C) that he will switch to brand B and probability C/(B + C) that he will switch to brand C. Suppose that the market is currently divided equally: 10,000 families for each of the three brands. a. After a year, what will the market share for each firm be? Assume pA = 0.10, pB = 0.15, and pC = 0.20. (Hint: You will need to use the RISKBINOMLAL function to see how many people switch from A and then use the RISKBENOMIAL function again to see how many switch from A to B and from A to C. However, if your model requires more RISKBINOMIAL functions than the number allowed in the academic version of @RISK, remember that you can instead use the BENOM.INV (or the old CRITBENOM) function to generate binomially distributed random numbers. This takes the form =BINOM.INV (ntrials, psuccess, RAND()).) b. Suppose a 1% increase in market share is worth 10,000 per week to company A. Company A believes that for a cost of 1 million per year it can cut the percentage of unsatisfactory juice cartons in half. Is this worthwhile? (Use the same values of pA, pB, and pC as in part a.)In Example 11.1, the possible profits vary from negative to positive for each of the 10 possible bids examined. a. For each of these, use @RISKs RISKTARGET function to find the probability that Millers profit is positive. Do you believe these results should have any bearing on Millers choice of bid? b. Use @RISKs RISKPERCENTILE function to find the 10th percentile for each of these bids. Can you explain why the percentiles have the values you obtain?
- It is surprising (but true) that if 23 people are in the same room, there is about a 50% chance that at least two people will have the same birthday. Suppose you want to estimate the probability that if 30 people are in the same room, at least two of them will have the same birthday. You can proceed as follows. a. Generate random birthdays for 30 different people. Ignoring the possibility of a leap year, each person has a 1/365 chance of having a given birthday (label the days of the year 1 to 365). You can use the RANDBETWEEN function to generate birthdays. b. Once you have generated 30 peoples birthdays, how can you tell whether at least two people have the same birthday? One way is to use Excels RANK function. (You can learn how to use this function in Excels online help.) This function returns the rank of a number relative to a given group of numbers. In the case of a tie, two numbers are given the same rank. For example, if the set of numbers is 4, 3, 2, 5, the RANK function returns 2, 3, 4, 1. (By default, RANK gives 1 to the largest number.) If the set of numbers is 4, 3, 2, 4, the RANK function returns 1, 3, 4, 1. c. After using the RANK function, you should be able to determine whether at least two of the 30 people have the same birthday. What is the (estimated) probability that this occurs?The eTech Company is a fairly recent entry in the electronic device area. The company competes with Apple. Samsung, and other well-known companies in the manufacturing and sales of personal handheld devices. Although eTech recognizes that it is a niche player and will likely remain so in the foreseeable future, it is trying to increase its current small market share in this huge competitive market. Jim Simons, VP of Production, and Catherine Dolans, VP of Marketing, have been discussing the possible addition of a new product to the companys current (rather limited) product line. The tentative name for this new product is ePlayerX. Jim and Catherine agree that the ePlayerX, which will feature a sleeker design and more memory, is necessary to compete successfully with the big boys, but they are also worried that the ePlayerX could cannibalize sales of their existing productsand that it could even detract from their bottom line. They must eventually decide how much to spend to develop and manufacture the ePlayerX and how aggressively to market it. Depending on these decisions, they must forecast demand for the ePlayerX, as well as sales for their existing products. They also realize that Apple. Samsung, and the other big players are not standing still. These competitors could introduce their own new products, which could have very negative effects on demand for the ePlayerX. The expected timeline for the ePlayerX is that development will take no more than a year to complete and that the product will be introduced in the market a year from now. Jim and Catherine are aware that there are lots of decisions to make and lots of uncertainties involved, but they need to start somewhere. To this end. Jim and Catherine have decided to base their decisions on a planning horizon of four years, including the development year. They realize that the personal handheld device market is very fluid, with updates to existing products occurring almost continuously. However, they believe they can include such considerations into their cost, revenue, and demand estimates, and that a four-year planning horizon makes sense. In addition, they have identified the following problem parameters. (In this first pass, all distinctions are binary: low-end or high-end, small-effect or large-effect, and so on.) In the absence of cannibalization, the sales of existing eTech products are expected to produce year I net revenues of 10 million, and the forecast of the annual increase in net revenues is 2%. The ePIayerX will be developed as either a low-end or a high-end product, with corresponding fixed development costs (1.5 million or 2.5 million), variable manufacturing costs ( 100 or 200). and selling prices (150 or 300). The fixed development cost is incurred now, at the beginning of year I, and the variable cost and selling price are assumed to remain constant throughout the planning horizon. The new product will be marketed either mildly aggressively or very aggressively, with corresponding costs. The costs of a mildly aggressive marketing campaign are 1.5 million in year 1 and 0.5 million annually in years 2 to 4. For a very aggressive campaign, these costs increase to 3.5 million and 1.5 million, respectively. (These marketing costs are not part of the variable cost mentioned in the previous bullet; they are separate.) Depending on whether the ePlayerX is a low-end or high-end produce the level of the ePlayerXs cannibalization rate of existing eTech products will be either low (10%) or high (20%). Each cannibalization rate affects only sales of existing products in years 2 to 4, not year I sales. For example, if the cannibalization rate is 10%, then sales of existing products in each of years 2 to 4 will be 10% below their projected values without cannibalization. A base case forecast of demand for the ePlayerX is that in its first year on the market, year 2, demand will be for 100,000 units, and then demand will increase by 5% annually in years 3 and 4. This base forecast is based on a low-end version of the ePlayerX and mildly aggressive marketing. It will be adjusted for a high-end will product, aggressive marketing, and competitor behavior. The adjustments with no competing product appear in Table 2.3. The adjustments with a competing product appear in Table 2.4. Each adjustment is to demand for the ePlayerX in each of years 2 to 4. For example, if the adjustment is 10%, then demand in each of years 2 to 4 will be 10% lower than it would have been in the base case. Demand and units sold are the samethat is, eTech will produce exactly what its customers demand so that no inventory or backorders will occur. Table 2.3 Demand Adjustments When No Competing Product Is Introduced Table 2.4 Demand Adjustments When a Competing Product Is Introduced Because Jim and Catherine are approaching the day when they will be sharing their plans with other company executives, they have asked you to prepare an Excel spreadsheet model that will answer the many what-if questions they expect to be asked. Specifically, they have asked you to do the following: You should enter all of the given data in an inputs section with clear labeling and appropriate number formatting. If you believe that any explanations are required, you can enter them in text boxes or cell comments. In this section and in the rest of the model, all monetary values (other than the variable cost and the selling price) should be expressed in millions of dollars, and all demands for the ePlayerX should be expressed in thousands of units. You should have a scenario section that contains a 0/1 variable for each of the binary options discussed here. For example, one of these should be 0 if the low-end product is chosen and it should be 1 if the high-end product is chosen. You should have a parameters section that contains the values of the various parameters listed in the case, depending on the values of the 0/1 variables in the previous bullet For example, the fixed development cost will be 1.5 million or 2.5 million depending on whether the 0/1 variable in the previous bullet is 0 or 1, and this can be calculated with a simple IF formula. You can decide how to implement the IF logic for the various parameters. You should have a cash flows section that calculates the annual cash flows for the four-year period. These cash flows include the net revenues from existing products, the marketing costs for ePlayerX, and the net revenues for sales of ePlayerX (To calculate these latter values, it will help to have a row for annual units sold of ePlayerX.) The cash flows should also include depreciation on the fixed development cost, calculated on a straight-line four-year basis (that is. 25% of the cost in each of the four years). Then, these annual revenues/costs should be summed for each year to get net cash flow before taxes, taxes should be calculated using a 32% tax rate, and taxes should be subtracted and depreciation should be added back in to get net cash flows after taxes. (The point is that depreciation is first subtracted, because it is not taxed, but then it is added back in after taxes have been calculated.) You should calculate the company's NPV for the four-year horizon using a discount rate of 10%. You can assume that the fixed development cost is incurred now. so that it is not discounted, and that all other costs and revenues are incurred at the ends of the respective years. You should accompany all of this with a line chart with three series: annual net revenues from existing products; annual marketing costs for ePlayerX; and annual net revenues from sales of ePlayerX. Once all of this is completed. Jim and Catherine will have a powerful tool for presentation purposes. By adjusting the 0/1 scenario variables, their audience will be able to see immediately, both numerically and graphically, the financial consequences of various scenarios.The method for rating teams in Example 7.8 is based on actual and predicted point spreads. This method can be biased if some teams run up the score in a few games. An alternative possibility is to base the ratings only on wins and losses. For each game, you observe whether the home team wins. Then from the proposed ratings, you predict whether the home team will win. (You predict the home team will win if the home team advantage plus the home teams rating is greater than the visitor teams rating.) You want the ratings such that the number of predictions that match the actual outcomes is maximized. Try modeling this. Do you run into difficulties? (Remember that Solver doesnt like IF functions.) EXAMPLE 7.8 RATING NFL TEAMS9 We obtained the results of the 256 regular-season NFL games from the 2015 season (the 2016 season was still ongoing as we wrote this) and entered the data into a spreadsheet, shown at the bottom of Figure 7.38. See the file NFL Ratings Finished.xlsx. (Some of these results are hidden in Figure 7.38 to conserve space.) The teams are indexed 1 to 32, as shown at the top of the sheet. For example, team 1 is Arizona, team 2 is Atlanta, and so on. The first game entered (row 6) is team 19 New England versus team 25 Pittsburgh, played at New England. New England won the game by a score of 28 to 21, and the point spread (home team score minus visitor team score) is calculated in column J. A positive point spread in column J means that the home team won; a negative point spread indicates that the visiting team won. The goal is to determine a set of ratings for the 32 NFL teams that most accurately predicts the actual outcomes of the games played.
- In August of the current year, a car dealer is trying to determine how many cars of the next model year to order. Each car ordered in August costs 20,000. The demand for the dealers next year models has the probability distribution shown in the file P10_12.xlsx. Each car sells for 25,000. If demand for next years cars exceeds the number of cars ordered in August, the dealer must reorder at a cost of 22,000 per car. Excess cars can be disposed of at 17,000 per car. Use simulation to determine how many cars to order in August. For your optimal order quantity, find a 95% confidence interval for the expected profit.A common decision is whether a company should buy equipment and produce a product in house or outsource production to another company. If sales volume is high enough, then by producing in house, the savings on unit costs will cover the fixed cost of the equipment. Suppose a company must make such a decision for a four-year time horizon, given the following data. Use simulation to estimate the probability that producing in house is better than outsourcing. If the company outsources production, it will have to purchase the product from the manufacturer for 25 per unit. This unit cost will remain constant for the next four years. The company will sell the product for 42 per unit. This price will remain constant for the next four years. If the company produces the product in house, it must buy a 500,000 machine that is depreciated on a straight-line basis over four years, and its cost of production will be 9 per unit. This unit cost will remain constant for the next four years. The demand in year 1 has a worst case of 10,000 units, a most likely case of 14,000 units, and a best case of 16,000 units. The average annual growth in demand for years 2-4 has a worst case of 7%, a most likely case of 15%, and a best case of 20%. Whatever this annual growth is, it will be the same in each of the years. The tax rate is 35%. Cash flows are discounted at 8% per year.