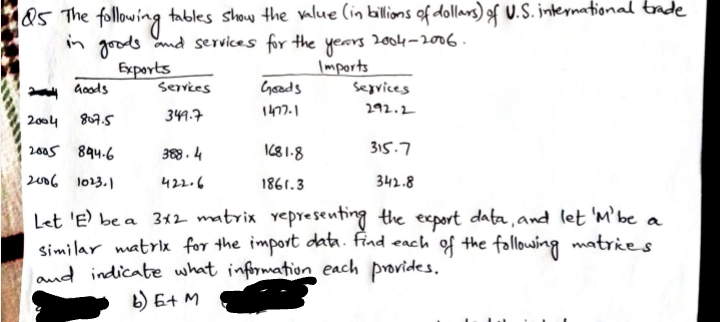
&5 The following tables show the value (in billions of dollars) of U.Š. international tade in goods nd services for the years 2004-2006. Exports |mports A doods Servies Goods Segvices 344.7 1477.1 292.2 2004 807.5 2005 894.6 38.4 IC8 1-8 315.7 2006 l013.1 422.6 1861.3 342.8 Let 'E be a 312 matrix vepresenting the export data, and let 'm'be similar matrk for the import data. Find each of the fallowing matries land indicate what information each provides. a b) Et M


Q: Which of the following sets of data represent valid functions? OS = {(0, – 2), (3, 1), (6, 4), (9,…
A: choose the correct option.
Q: 2. The following table of grouped data represents the ages (in years) of 100 singers of a 360-member…
A: Solution The given data is a grouped frequency data represents the ages (in years) of 100 singers of…
Q: Let x be the age in years of a licensed automobile driver. Let y be the percentage of all fatal…
A: Note:- As per our policy we can answer only three sub-parts of a question at a time, please make a…
Q: 6) The table below shows the approximate GPA (Grade Point Average) for students as it relates to how…
A: a) The scatter plot is
Q: Answer a,b,c
A:
Q: Let x be the age in years of a licensed automobile driver. Let y be the percentage of all fatal…
A: Solution:(a) Draw a scatter diagram displaying the data.
Q: (1) Let x be the age in years of a licensed automobile driver. Let y be the percentage of all fatal…
A: Hello. Since you have posted multiple questions and not specified which question needs to be solved,…
Q: The costs per load (in cents) of 35 laundry detergents tested by a consumer organization are shown…
A: We have given, Class Limits Frequency 13-19 2 20-26 7 27-33 12 34-40 5 41-47 6 48-54…
Q: 5. Below is data on car crashes of small, midsize and large cars. The load (pounds) on left and…
A: Output:
Q: The electric power consumed each month by a chemical plant is thought to be related to the average…
A:
Q: The following table lists the income tax rates for a single person earning $30,000 p State A B C DE…
A:
Q: The number of pounds of steam used per month by a chemical plant is thought to be related to the…
A: “Since you have posted a question with multiple sub-parts, we will solve first three sub-parts for…
Q: *11. A busy airport collected the data below on the number of passengers by airline for a particular…
A: Using the 2k≥n (Sturge's rule) we compute the number of classes as follow…
Q: (a) The table below shows the average wages in Kwachas per week of a group of industrial workers…
A: note: Hey, since there are multiple questions posted, we will answer first question. If you want any…
Q: Montgomery, Peck, and Vining (2o01) present data concerning the performance of the 28 National…
A: There are 28 teams. So, n = 28. The given data of X and Y is: x y 2205 10 2096 11 1847 11…
Q: QOCH.C The number of cell phones per 100 residents in countries in Europe is given in Table #1 for…
A: For Cell Phones per 100 Residents in Europe: Sample x1 (x1-x̄1)^2 1 100 66.4225 2 112…
Q: 10. Sketch a scatterplot for these data: 10 8 4 3 2 1 1 2 3 4 7 8. 9. 10
A: We have given that the data of 7 participants A, B, C, D, E, F and G.
Q: 1. The number of pounds of steam used per month by a chemical plant is thought to be related to the…
A:
Q: se prices: The following table presents prices, in thousands of dollars, of single-family homes for…
A: Given : Table represents prices , in thousands of dollars , of single – family homes for some of…
Q: IOG Technologies offers semiconductor and system solutions for automotive industrial and multimarket…
A: The objective is to find out LPI and PPI for 2016 for the following data using 2000 as the base…
Q: Time spent waiting in line for each moviegoer at each of four movie theaters in Downtown San…
A: To find: Consider the variable time-spent-waiting-in-line. Which of the theaters would you expect to…
Q: An investigator wants to test if there is a difference in endotoxin levels in children who are…
A: SolutionAn investigator interested to study whether there is a difference in endotoxin levels in…
Q: The following is two years monthly sales data of 5different outlets of a well-known textile brand.…
A: Given is two years' monthly sales data of 5 different outlets of a well-known textile brand. Here we…
Q: Which of the following would be the LSRL for the given data? |1 4 8 12 15 19 y 43 37 26 20 24 11 a)…
A: The equation of the least squares regression line is given by,
Q: 2.62 For the period 2001–2008, the Bristol-Myers Squibb Company, Inc. reported the following amounts…
A: Here we have the following report on the amount of the net sales and spend on advertising/product…
Q: Consider the following hypothetical data showing the daily amount of rainfall for 10 weeks during…
A: a. Formula for Average is, Average rainfall=Sum of all observationsNumber of observations Average…
Q: he following data give the average price received by fishermen for several species of fish in 2000…
A:
Q: SS and SS between for the following 4. Calculate SS total within set of data: Treatment 1 Treatment…
A: 4.The value for SStotal for the following set of data is obtained below:
Q: The electric power consumed each month by a chemical plant is thought to be related to the average…
A: We need to find the multiple linear regression model given in the question.
Q: The electric power consumed each month by a chemical plant is thought to be related to the average…
A: Formula Used: Multiple linear regression: Y = b0 + b1X1 + b2X2 + b3X3 + b4X4 Where, Y is dependent…
Q: The values listed below are waiting times (in minutes) of customers at two different banks. At Bank…
A: GivenThe values listed below are waiting times of customers at two different banks. The mean of Bank…
Q: The number of pounds of steam used per month by a chemical plant is thought to be related to the…
A:
Q: A. For items 1-8, Complete the column under Lower Boundaries. CLASS INTERVAL Less than cumulative…
A: Given the frequency distribution table to calculate the value of D5
Q: Find average in classified data set (k=4) Sınıflandırılmış verilerde ortalamayı bulunuz (k=4) 6 - 17…
A: Given data is appropriate for mean of a series is the figure obtained by dividing the total values…
Q: 3. The following data describe the catch an average price for three Alaskan crab species from 1980…
A: Laspeyres Price Index: It a ratio that uses the weights taken from a base period which can be the…
Q: The electric power consumed each month by a chemical plant is thought to be related to the average…
A: Given: The dependent variable y is given. x1, x2 , x3, x4 are the dependent variable.
Q: An instructor asked a random sample of eight students to record their study times at the beginning…
A: Since you have posted a question with multiple sub-parts, we will solve first three sub-parts for…
Q: 4) The table shows, for the years 1997–2012, the mean hourly wage for residents of the town of Pity…
A: Consider, mean hourly wages are denoted by X and mean weekly rent by Y.The provided data can be…
Q: William Profit is studying companies going public for the first time. He is particularly interested…
A: The given data is shown below x y 9 10.8 94.4 11.3 27.3 11.2 179.2 11.1 71.9 11.1…
Q: The following table shows the time spent by 200 students in watching television programs during in…
A:
Q: and visual streams streams, in billions, is given in the following table for 2014-2019. 2019 2018…
A: To Determine:
Q: The electric power consumed each month by a chemical plant is thought to be related to the average…
A: Excel Procedure: Enter y, x1, x2, x3, x4 in Excel>Data>Data Analysis>…
Q: Percent Under 21 Fatal Accidents per 1000 13 2.962 12 0.708 8 0.885 12 1.652 11 2.091 17 2.627 18…
A:
Q: The number of pounds of steam used per month by a chemical plant is thought to be related to the…
A: The independent variable is Temperature. The dependent variable is Usage/1000. We have to do…
Q: Calculate SST, SSB, and SSw for the following set of data: Treatment 1 Treatment 2 Treatment 3 n =…
A: The provided information are: Treatment 1:n=10, T=10,SS=27Treatment 2:n=10, T=20, SS=16Treatment…
Q: Year and contribution data are as follows: Contribution y Years x 500 100 300 10 50 75 6. 80 Predict…
A: Solution-: Let, X=Years, Y=Contribution Given data: X Y 1 500 5 100 3 300 10 50 7 75…
Q: alculate SStotal, SSbetween, and SSwithin for the following set of data: Treatment 1…
A: given that SS = 27 SS = 16 SS = 23 ∑X2 = 206
Q: The number of pounds of steam used per month by a chemical plant is thought to be related to the…
A: Since you have posted a question with multiple sub-parts, we will solve first three subparts for…
Q: C. Identify the following quantitative variables as discrete or continuous 1. Average speed 2.…
A: Discrete variable: The variable which can be counted in numbers are called discrete variables. It…
Q: 1) The following table gives the age-adjusted cancer incidence rates (new cases) per 100,000 people…
A: As per guidelines, we will only answer first question, for more solutions please repost the other…

Step by step
Solved in 2 steps with 1 images


- A customer in the wholesale garment trade is often entitled to a discount for a cash payment for goods.The amount of discount varies by vendor. A sample of 150 items selected from a population of 4,000invoices at the end of a period of time revealed that in 13 cases, the customer failed to take thediscount to which he or she was entitled. The amounts (in dollars) of the 13 discounts that were nottaken were as follows:6.45, 15.32, 97.36, 230.63, 104.18, 84.92, 132.76, 66.12, 26.55, 129.43, 88.32, 47.81, 89.01Construct a 99% confidence interval estimate of the population total amount of discounts not takenClassify the following statements as to whether they belong to the area ofdescriptive statistics or inferential statistics___________________ 1. At most 5% of SLU students are smokers.___________________ 2. Assuming that less than 20% of the Kalinga coffee beans weredestroyed by a typhoon these past months, we should expect anincrease of no more than P30 for a kilogram of coffee by the endof the year. ___________________ 3. An employee generalized that the average monthly salary of a regular employee in a certain company is P12,000. ___________________ 4. A study found out that all customers who have received a giftcertificate from a store 75% went back to the store to shop.___________________ 5. The average grade in statistics of 50 students is 83.60.Sampling 4 pieces of precision-cut wire (to be used in computer assembly) every hour for the past 24 hours has produced the following results: Hour x R Hour x R Hour x R Hour x R 1 3.25" 0.76" 7 3.05" 0.48" 13 3.21" 0.85" 19 3.31" 1.56" 2 3.20 1.23 8 2.65 1.08 14 2.83 1.36 20 2.99 1.09 3 3.12 1.48 9 3.02 0.66 15 3.22 1.01 21 2.75 1.08 4 3.39 1.31 10 2.85 1.28 16 2.74 0.45 22 3.18 0.46 5 3.07 1.22 11 2.73 1.17 17 2.96 1.48 23 2.84 1.53 6 2.96 0.37 12 2.87 0.45 18 2.64 1.34 24 2.74 0.92 Based on the sampling done, the control limits for 3-sigma x chart are (round all intermediate calculations to three decimal places…
- Sampling 4 pieces of precision-cut wire (to be used in computer assembly) every hour for the past 24 hours has produced the following results: Hour x R Hour x R Hour x R Hour x R 1 3.25" 0.71" 7 2.95" 0.58" 13 3.21" 0.80" 19 3.41" 1.56" 2 3.20 1.18 8 2.75 1.13 14 2.83 1.26 20 2.89 1.04 3 3.22 1.38 9 3.12 0.71 15 3.12 1.01 21 2.75 1.13 4 3.29 1.31 10 2.85 1.38 16 2.84 0.45 22 3.28 0.51 5 3.17 1.12 11 2.83 1.17 17 2.86 1.48 23 2.94 1.63 6 2.76 0.32 12 3.07 0.45 18 2.84 1.24 24 2.74 0.92 Based on the sampling done, the control limits for 3-sigma x chart are (round all intermediate calculations to three decimal places…Sampling 4 pieces of precision-cut wire (to be used in computer assembly) every hour for the past 24 hours has produced the following results: Hour x R Hour x R Hour x R Hour x R 1 3.25" 0.71" 7 3.15" 0.58" 13 3.11" 0.90" 19 3.31" 1.61" 2 3.20 1.18 8 2.55 1.13 14 2.83 1.31 20 2.99 1.14 3 3.32 1.38 9 3.12 0.76 15 3.22 1.06 21 2.55 1.13 4 3.29 1.21 10 2.85 1.38 16 2.94 0.45 22 3.38 0.51 5 2.97 1.22 11 2.83 1.22 17 2.86 1.48 23 3.04 1.58 6 2.96 0.37 12 2.87 0.35 18 2.84 1.24 24 2.74 0.97 Based on the sampling done, the control limits for 3-sigma x chart are (round all intermediate calculations to three decimal places before proceeding with further calculations): Part 2 Upper Control Limit (UCLx) = ? inches (round…A customer in the wholesale garment trade is often entitled to a discount for a cash payment for goods. The amount of discounts varies by vendor. A sample of 150 items selected from a population of 4000 invoices at the end of period of time revealed that in 13 cases, the customer failed to take the discount to which he or she was entitled . The amount of the 13 discounts that were not taken were as follows: 6.45, 15.32, 97.36, 230.63, 104.18, 84.92, 132.76, 66.12, 26.55, 129.43, 88.32, 47.81, 89.01 Construct a 99% confidence interval estimate of the population total amount of discounts not taken.
- The following table indicates the unit prices (in Rands) and quantities of three goods purchased every month by a bakery for the years 2022 and 2023.GOOD20222023Unit Price (p0)Quantity (q0))Unit Price (p1)Quantity (q1)EggsR2.602550R2.852700FlourR61.00109R64.00103Sesame seedsR115.00345R118.5039523 2023© The Independent Institute of Education (Pty) Ltd 2023Page 7 of 8Q.3.1Using 2022 as the base year, compute the price relatives in 2023 for eggs and sesame seeds. Interpret your answers.(10)Q.3.2Using 2022 as the base year, compute the Laspeyres price index for all of the goods for 2023. Interpret your answer.(8)Q.3.3Using 2022 as the base year, compute the Paasche price index for all of the goods for 2023. Interpret your answer.(7)[TOTALCalculate the test-statistic, t with the following information.n1=55, ¯x1=2.61, s1=0.67n2=25, ¯x2=2.49, s2=0.62Rounded to 2 decimal places.A market researcher for a consumer electronics company wants to study the media viewing behavior of residence of a particular area. A random sample of 40 respondents is selected and each respondent is instructed to keep a detailed Record of time spent in gaged doing contact across all screens in a particular week. The results are as follows: continuing time per week: x=54 hours, s=4.1 hours. 8 respondents have high definition on at least one television set.
- Find Cumulative Distribution Function (cdf) of X, F(x), x {0, 1, 2,...}A water park has an 18-minute ride through man-made rapids and waterfalls. When the ride is in full operation, riding times for passengers are uniformly distributed between 0 and 18 minutes. Suppose an electrical problem leads to a temporary stoppage. What percent of the riders had been on the ride for less than 2 minutes when the stoppage occured? And what percent of the riders had been on the ride between 10 and 15 minutes when the stoppage occured?A research center claims that 26% of adults in a certain country would travel into space on a commercial flight if they could afford it. In a random sample of 1000 adults in that country, 29% say that they would travel into space on a commercial flight if they could afford it. At α=0.05, is there enough evidence to reject the research center's claim? Complete parts (a) through (d) below. (a) Identify the claim and state H0 and Ha. "Recall that the claim is the percentage of adults in the country would travel into space on a commercial flight if they could afford it. Let a success be an adult in the country who would travel into space on a commercial flight if they could afford it. Translate the claim made about the population parameter from a verbal statement to a mathematical statement." (b) Use technology to find the P-value. (c) Decide whether to reject or fail to reject the null hypothesis and (d) interpret the decision in the context of the original claim.