se prices: The following table presents prices, in thousands of dollars, of single-family homes for some of the largest opolitan areas in the United States for the first quarter 2012 and the first quarter of 2013. Metro Areа 2012 2013 Baltimore, MD 218.1 226.5 Boston, MA 311.5 332.2 Chicago, IL Cincinnati, OH Cleveland, OH Dallas, TX 157.2 159.4 112.5 121.0 84.9 101.0 148.2 160.4 Denver, CO 226.4 261.2 Houston, TX 152.1 163.7 Las Vegas, NV 122.1 155.1 Miami, FL 182.0 219.9 Source: National Realtors Association Send data to Excel Part 1 of 2 (a) Find the population standard deviation for 2012. Round the answer to at least two decimal places. In 2012, the population standard deviation, in thousands of dollars, was Part 2 of 2 (b) Find the population standard deviation for 2013. Round the answer to at least two decimal places. In 2013. the population standard deviation, in thousands of dollars, was
se prices: The following table presents prices, in thousands of dollars, of single-family homes for some of the largest opolitan areas in the United States for the first quarter 2012 and the first quarter of 2013. Metro Areа 2012 2013 Baltimore, MD 218.1 226.5 Boston, MA 311.5 332.2 Chicago, IL Cincinnati, OH Cleveland, OH Dallas, TX 157.2 159.4 112.5 121.0 84.9 101.0 148.2 160.4 Denver, CO 226.4 261.2 Houston, TX 152.1 163.7 Las Vegas, NV 122.1 155.1 Miami, FL 182.0 219.9 Source: National Realtors Association Send data to Excel Part 1 of 2 (a) Find the population standard deviation for 2012. Round the answer to at least two decimal places. In 2012, the population standard deviation, in thousands of dollars, was Part 2 of 2 (b) Find the population standard deviation for 2013. Round the answer to at least two decimal places. In 2013. the population standard deviation, in thousands of dollars, was

MATLAB: An Introduction with Applications
6th Edition
ISBN:9781119256830
Author:Amos Gilat
Publisher:Amos Gilat
Chapter1: Starting With Matlab
Section: Chapter Questions
Problem 1P

Related questions

Topic Video
Question
Transcribed Image Text:3.2 Section Exerc
dndode ui uonsanb MalA
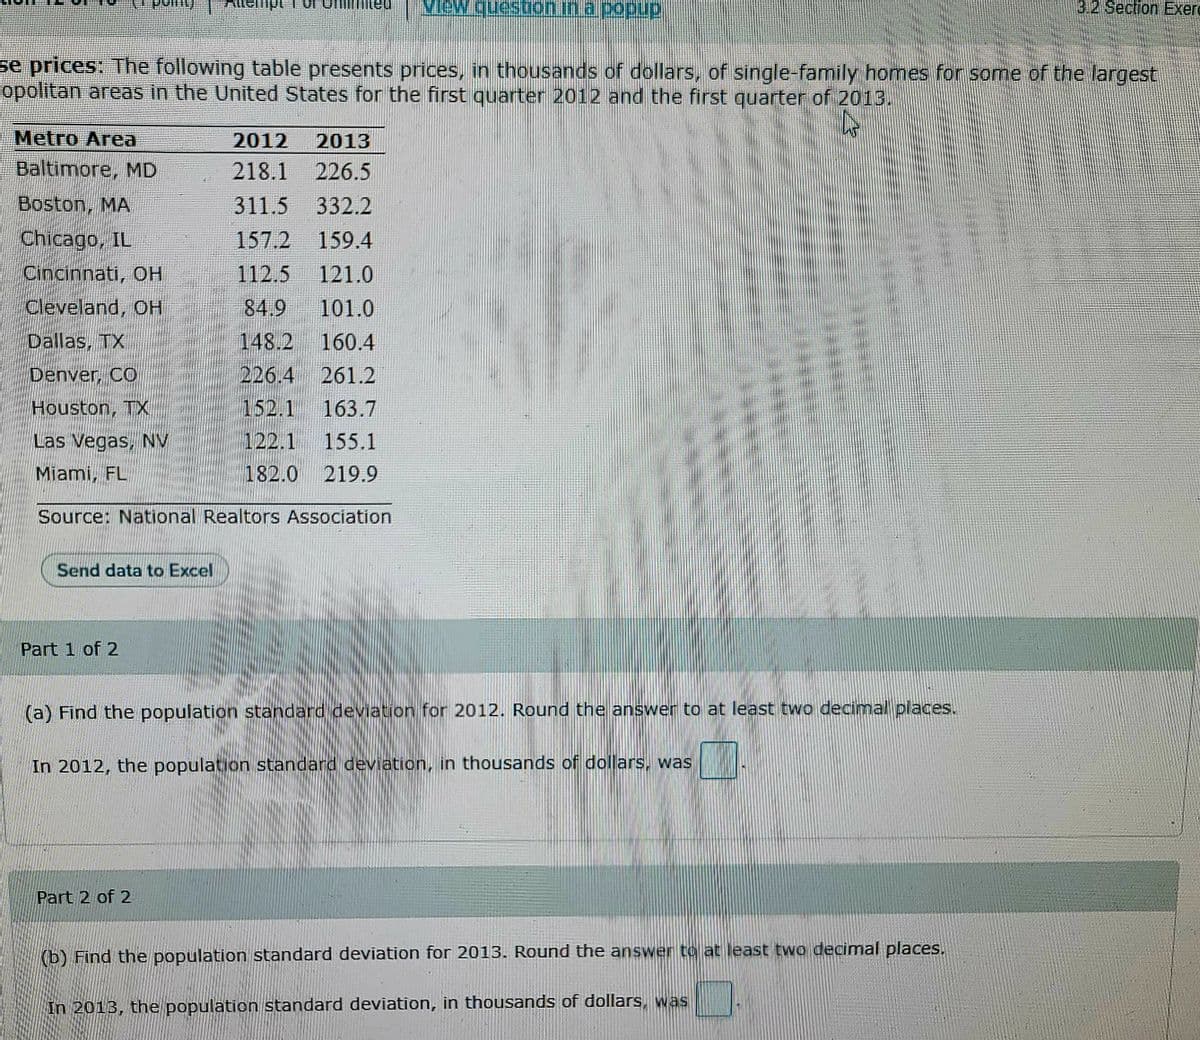
se prices: The following table presents prices, in thousands of dollars, of single-family homes for some of the largest
opolitan areas in the United States for the first quarter 2012 and the first quarter of 2013.
Metro Area
2012
2013
Baltimore, MD
218.1 226.5
Boston, MA
311.5 332.2
157.2 159.4
112.5
Chicago, IL
Cincinnati, OH
121.0
Cleveland, OH
84.9
101.0
Dallas, TX
148.2
160.4
Denver, CO
226.4 261.2
152.1
122.1 155.1
Houston, TX
163.7
Las Vegas, NV
Miami, FL
182.0 219.9
Source: National Realtors Association
Send data to Excel
Part 1 of 2
(a) Find the population standard deviation for 2012. Round the answer to at least two decimal places.
In 2012, the population standard deviation, in thousands of dollars, was
Part 2 of 2
(b) Find the population standard deviation for 2013. Round the answer to at least two decimal places.
In 2013, the population standard deviation, in thousands of dollars, was
Expert Solution
This question has been solved!
Explore an expertly crafted, step-by-step solution for a thorough understanding of key concepts.

This is a popular solution!

Trending now
This is a popular solution!

Step by step
Solved in 2 steps with 6 images

Knowledge Booster


Learn more about
Need a deep-dive on the concept behind this application? Look no further. Learn more about this topic, statistics and related others by exploring similar questions and additional content below.Recommended textbooks for you
MATLAB: An Introduction with Applications
Statistics
ISBN:
9781119256830
Author:
Amos Gilat
Publisher:
John Wiley & Sons Inc

Probability and Statistics for Engineering and th…
Statistics
ISBN:
9781305251809
Author:
Jay L. Devore
Publisher:
Cengage Learning

Statistics for The Behavioral Sciences (MindTap C…
Statistics
ISBN:
9781305504912
Author:
Frederick J Gravetter, Larry B. Wallnau
Publisher:
Cengage Learning
MATLAB: An Introduction with Applications
Statistics
ISBN:
9781119256830
Author:
Amos Gilat
Publisher:
John Wiley & Sons Inc
Probability and Statistics for Engineering and th…
Statistics
ISBN:
9781305251809
Author:
Jay L. Devore
Publisher:
Cengage Learning
Statistics for The Behavioral Sciences (MindTap C…
Statistics
ISBN:
9781305504912
Author:
Frederick J Gravetter, Larry B. Wallnau
Publisher:
Cengage Learning

Elementary Statistics: Picturing the World (7th E…
Statistics
ISBN:
9780134683416
Author:
Ron Larson, Betsy Farber
Publisher:
PEARSON

The Basic Practice of Statistics
Statistics
ISBN:
9781319042578
Author:
David S. Moore, William I. Notz, Michael A. Fligner
Publisher:
W. H. Freeman

Introduction to the Practice of Statistics
Statistics
ISBN:
9781319013387
Author:
David S. Moore, George P. McCabe, Bruce A. Craig
Publisher:
W. H. Freeman