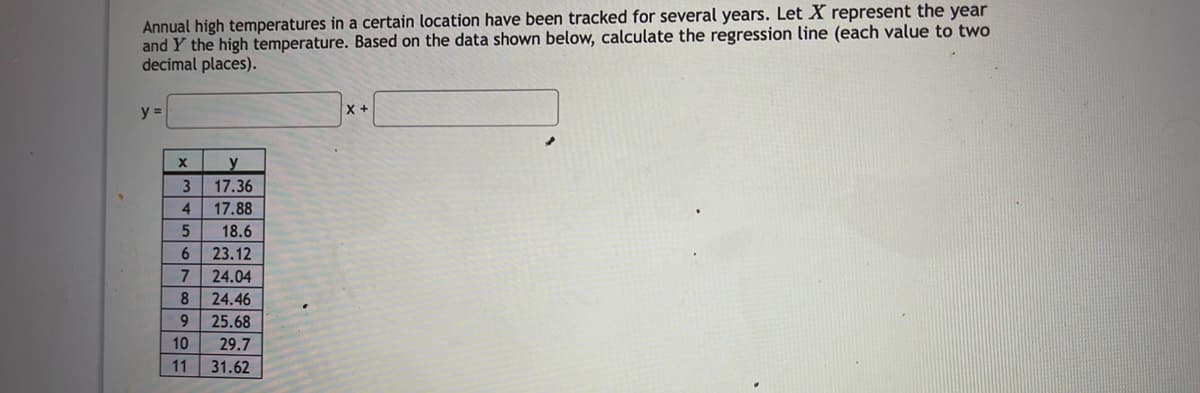
Annual high temperatures in a certain location have been tracked for several years. Let and Y the high temperature. Based on the data shown below, calculate the regression line (each value to two decimal places). y = X + 17.36 4. 17.88 18.6 6. 23.12 7 24.04 8 24.46 9. 25.68 10 29.7 11 31.62


Q: Researchers were interested in the relationship between the number of prescription medications (x)…
A: Given information- We have given the table by which we have to find the relationship between the…
Q: Annual high temperatures in a certain location have been tracked for several years. Let XX represent…
A: We have given that X: 5, 6, 7, 8, 9, 10, 11, 12, 13, 14, 15, 16, 17, 18, 19, 20 Y:…
Q: Fit a regression line to the data shown in the chart, and find the coefficient of correlation for…
A:
Q: Consider the data in the table on the right showing the average life expectancy of women in various…
A: Regression equation: y = mx+b
Q: Find the equation of the regression line for the given data. Then construct a scatter plot of the…
A: Given data set is : Hours spent studying, x 1 1 2 4 4 5 Test score, y 40 44 52 48 63 71
Q: Find the equation of the regression line for the given data. Then construct a scatter plot of the…
A: Scatter plot: Excel Procedure: Enter x and y in Excel sheet>Select x and y> Insert>“Insert…
Q: Annual high temperatures in a certain location have been tracked for several years. Let XX represent…
A:
Q: Annual high temperatures in a certain location have been tracked for several years. Let X represent…
A:
Q: Let y be the value of the dependent variable for observation i and let , be the predicted value of…
A: We have given that Yi be the value of the dependent variable for observation i and Yi^ be the…
Q: The City of Bellmore’s police chief believes that maintenance costs on high-mileage police vehicles…
A: The City of Bellmore’s police chief believes that maintenance costs on high-mileage police vehicles…
Q: Annual high temperatures in a certain location have been tracked for several years. Let X represent…
A:
Q: An unknown metal has been found and the following experimental results have been tabulated in the…
A: Solution: Let x= Unknown metals in grmas and y = Volume in milliliters x y x2 xy 18 188.8…
Q: Find the equation of the regression line for the given data. Then construct a scatter plot of the…
A: We have given that, X :- 0, 1, 2, 4, 5, 5 Y:- 40, 45, 51, 49, 62, 67 Then, We will find the…
Q: Annual high temperatures in a certain location have been tracked for several years. Let X represent…
A: Scatter plot:
Q: Annual high temperatures in a certain location have been tracked for several years. Let X represent…
A: Given that Let X represent the year and Y the high temperature.... The data of X and Y is given in…
Q: Find the equation of the regression line for the given data. Then construct a scatter plot of the…
A: Use EXCEL to determine the regression equation. EXCEL procedure: Go to EXCEL Go to Data>Data…
Q: A) Write the linear regression equation for the data in the chart. Volume = __?__ x+ __?__ where…
A: Given Data : X = mass Y = volume 18 188.8 19.5 200.5 21 218.1 22.5 231.3 24 246.7…
Q: Let x = day of observation and y = number of locusts per square meter during a locust infestation in…
A: Determine the linear regression equation. Follows the below instructions to obtain the regression…
Q: Annual high temperatures in a certain location have been tracked for several years. Let X represent…
A: Find Regression line equations from the following data X Y 3 1.24 4 2.92 5 4 6 4.28 7…
Q: A researcher surveyed n = 13 students about the number of hours they spent in the library weekly (x)…
A:
Q: Annual high temperatures in a certain location have been tracked for several years. Let X represent…
A:
Q: Annual high temperatures in a certain location have been tracked for several years. Let X represent…
A: X Y X.Y X2 1 40.2 40.2 1 2 38.55 77.1 4 3 37.2 111.6 9 4 34.45 137.8 16 5 33.1 165.5…
Q: Annual high temperatures in a certain location have been tracked for several years. Let X represent…
A: find explanation below
Q: Run a regression analysis on the following data set, where y is the final grade in a math class and…
A: Regression: The regression analysis is conducted here by using EXCEL. The software procedure is…
Q: Annual high temperatures in a certain location have been tracked for several years. Let XX represent…
A:
Q: 1. Which quantity is the independent variable? O average mid-career salary of graduates O annual…
A:
Q: The police chief believes that maintenance costs on high-mileage police vehicles are much higher…
A: Solution: Note: Hello! As you have posted more than 3 sub parts, we are answering the first 3…
Q: Find the equation of the regression line for the given data. Then construct a scatter plot of the…
A: Given data, X Y X*Y X*X 1 39 39 1 2 45 90 4 2 50 100 4 4 49 196 16 5 63 315 25 5 73…
Q: Find the regression equation, letting the first variable be the predictor (x) variable. Using the…
A:
Q: Question in comment
A: (a) The following procedure is used to find out the regression equation for forecasting the…
Q: An unknown metal has been found and the following experimental results have been tabulated in the…
A:
Q: Annual high temperatures in a certain location have been tracked for several years. Let XX represent…
A: Given x y 2 14.14 3 18.16 4 20.68 5 22.3 6 22.82 7 26.64 8 29.26
Q: Annual high temperatures in a certain location have been tracked for several years. Let XX represent…
A: Find Regression line equations from the following data X Y 5 26.55 6 27.14 7 27.33 8…
Q: Find the equation of the regression line for the given data. Then construct a scatter plot of the…
A: Each regression equation has two type of variables, they are independent and dependent variable.…
Q: A random sample of ten professional athletes produced the following data where x is the number of…
A: Solution: Let X be the number of endorsements and Y be the amount of money made. The regression…
Q: Find the equation of the regression line for the given data. Then construct a scatter plot of the…
A: x y xy x2 y2 160 420 67200 25600 176400 180 470 84600 32400 220900 130 330 42900 16900…
Q: Run a regression analysis on the following data set, where y is the final grade in a math class and…
A: Solution 1) y =43.02+2.99*x
Q: Annual high temperatures in a certain location have been tracked for several years. Let X represent…
A: Solution
Q: Annual high temperatures in a certain location have been tracked for several years. Let XX represent…
A: Given n=8
Q: Consider the following linear regression model: y with hat on top equals 0.55 x plus 1.69 The…
A: Formula for residual : Residual = Observed y - Predicted y Residual = y - y^
Q: Sarah has some data and wants to run a linear regression model on it. Before she runs the test, s-…
A: Given:
Q: b) A study is conducted to determine the relationship between a driver's age and the number of…
A: Given,
Q: un a regression analysis on the following data set, where yy is the final grade in a math class and…
A: Given data, X Y X*Y X*X 8 55.2 441.6 64 8 62.2 497.6 64 8 53.2 425.6 64 10 70 700 100…
Q: Annual high temperatures in a certain location have been tracked for several years. Let XX represent…
A: The given data show the annual temperatures.
Q: Find the equation of the regression line for the given data. Then construct a scatter plot of the…
A:
Q: Annual high temperatures in a certain location have been tracked for several years. Let XX represent…
A: It is given that the random variable X represents the year and the random variable Y represents the…
Q: Annual high temperatures in a certain location have been tracked for several years. Let X represent…
A: Given that The given problem is solved using excel regression Excel: data: data analysis:…
Q: Annual high temperatures in a certain location have been tracked for several years. Let X represent…
A: The standard form of linear regression equation is , where a is the intercept and b is the slope of…
Q: Run a regression analysis on the following data set, where y is the final grade in a math class and…
A: Given observation and calculation x y x2 y2 xy 4 51.6 16 2662.56 206.4 4…


Trending now
This is a popular solution!

Step by step
Solved in 2 steps

- Olympic Pole Vault The graph in Figure 7 indicates that in recent years the winning Olympic men’s pole vault height has fallen below the value predicted by the regression line in Example 2. This might have occurred because when the pole vault was a new event there was much room for improvement in vaulters’ performances, whereas now even the best training can produce only incremental advances. Let’s see whether concentrating on more recent results gives a better predictor of future records. (a) Use the data in Table 2 (page 176) to complete the table of winning pole vault heights shown in the margin. (Note that we are using x=0 to correspond to the year 1972, where this restricted data set begins.) (b) Find the regression line for the data in part ‚(a). (c) Plot the data and the regression line on the same axes. Does the regression line seem to provide a good model for the data? (d) What does the regression line predict as the winning pole vault height for the 2012 Olympics? Compare this predicted value to the actual 2012 winning height of 5.97 m, as described on page 177. Has this new regression line provided a better prediction than the line in Example 2?Find the equation of the regression line for the given data. Then construct a scatter plot of the data and draw the regression line. (Each pair of variables has a significant correlation.) Then use the regression equation to predict the value of y for each of the given x-values, if meaningful. The caloric content and the sodium content (in milligrams) for 6 beef hot dogs are shown in the table below. Calories, x Sodium, y150 410180 460120 320120 36070 290190 540 (a) x=160 calories (b) x=90 calories (c) x=130 calories (d) x=220 calories Y=_____x+(___)(a) The standard error Se of the linear regression model is given in the printout as "S." What is the value of Se?
- Annual high temperatures in a certain location have been tracked for several years. Let XX represent the year and YY the high temperature. Based on the data shown below, calculate the regression line (each value to two decimal places).y = x + x y 1 13.09 2 14.96 3 11.33 4 13.4 5 11.87 6 10.94 7 12.61 8 12.58 9 11.35 10 10.22 11 9.99 12 10.16 13 7.03 14 9Annual high temperatures in a certain location have been tracked for several years. Let X represent the year and Y the high temperature. Based on the data shown below, calculate the regression line (each value to two decimal places).y = x + x y 5 8.3 6 9.06 7 9.12 8 11.98 9 8.44 10 12.4 11 9.56 12 11.22 13 10.08 14 10.74A sample consists of 500 houses sold in Karachi between January 2020 and December 2020. The multiple linear regression analysis is carried out to predict the house prices for investment in residential properties in Karachi, Pakistan. The output below is produced using SPSS. Model Unstandardized Coefficients t VIF Constant 14.208 5.736 Age of house -0.299 -2.322 1.58 Square footage of the house 0.364 2.931 1.71 Income of families in the area 0.004 0.392 1.01 Transportation time to major markets -0.337 -2.619 1.90, R2 = 0.67; DW = 2.08 How would you interpret the above ‘Output’ of a regression analysis performed in SPSS?
- A grass seed company conducts a study to determine the relationship between the density of seeds planted (in pounds per 500 sq ft) and the quality of the resulting lawn. Eight similar plots of land are selected and each is planted with a particular density of seed. One month later the quality of each lawn is rated on a scale of 0 to 100. The regression equation is given below, where x denotes seed density, and y denotes lawn quality. The correlation coefficient r = .600. y = 33.14 + 4.54x If possible, use the information to obtain an estimate of the mean lawn quality for all lawns sown with a seed density of 4.7 (assume 4.7 is within the domain of the observed seed densities). Pay attention to all details before choosing your answer of the 4 below. Choices: A.) Since the correlation coefficient, r, is less than rcrit = 0.707, the correlation is significant and the lawn quality estimate is 54.48. B.) Since the correlation coefficient, r, is less than rcrit =…A marketing manager conducted a study to determine the relationship between money spent on advertising (X) and company sales (Y). The study consisted of 8 companies and the data is given below and is in units of $1000s (ie. 2.4 = $2400.00) d. What is the resulting residual value when advertising expenditure is $2200.00 (X = 2.2), that is the difference between the actual observed value of y and the predicted value of y when using the fitted regression equation? e. What percentage of the variation in company sales is explained by the regression equation? In other words, what is the variability in Y that is due to advertising? Does a…which of the following regressions represents the strongest negative linear relationship between x and y? (Attached in picture provided)
- An article reported that for a regression of y = average SAT score on x = expenditure per pupil, based on data from n = 44 New Jersey school districts, a = 766, b = 0.015, r2 = 0.160, and se = 53.7. One observation in the sample was (9400, 897). What average SAT score would you predict for this district, and what is the corresponding residual?Predict average SAT score _______ Residual ________Annual high temperatures in a certain location have been tracked for several years. Let Xrepresent the year and Y the high temperature. Based on the data shown below, calculate the regression line (each value to two decimal places).y = x + x y 4 14.9 5 17 6 18.7 7 23.2 8 23.2 9 28 10 30.8 11 34.4 12 36.3 13 37.5 14 42.6 15 42.9 16 47.4Which of the following best describes a regression coefficient in a bivariate setting? a. The change in Y predicted by a unit change in X b. The slope of a line that minimizes the sum of squared residuals c. The correlation coefficient multiplied by SDy/SDx d. All of the above
