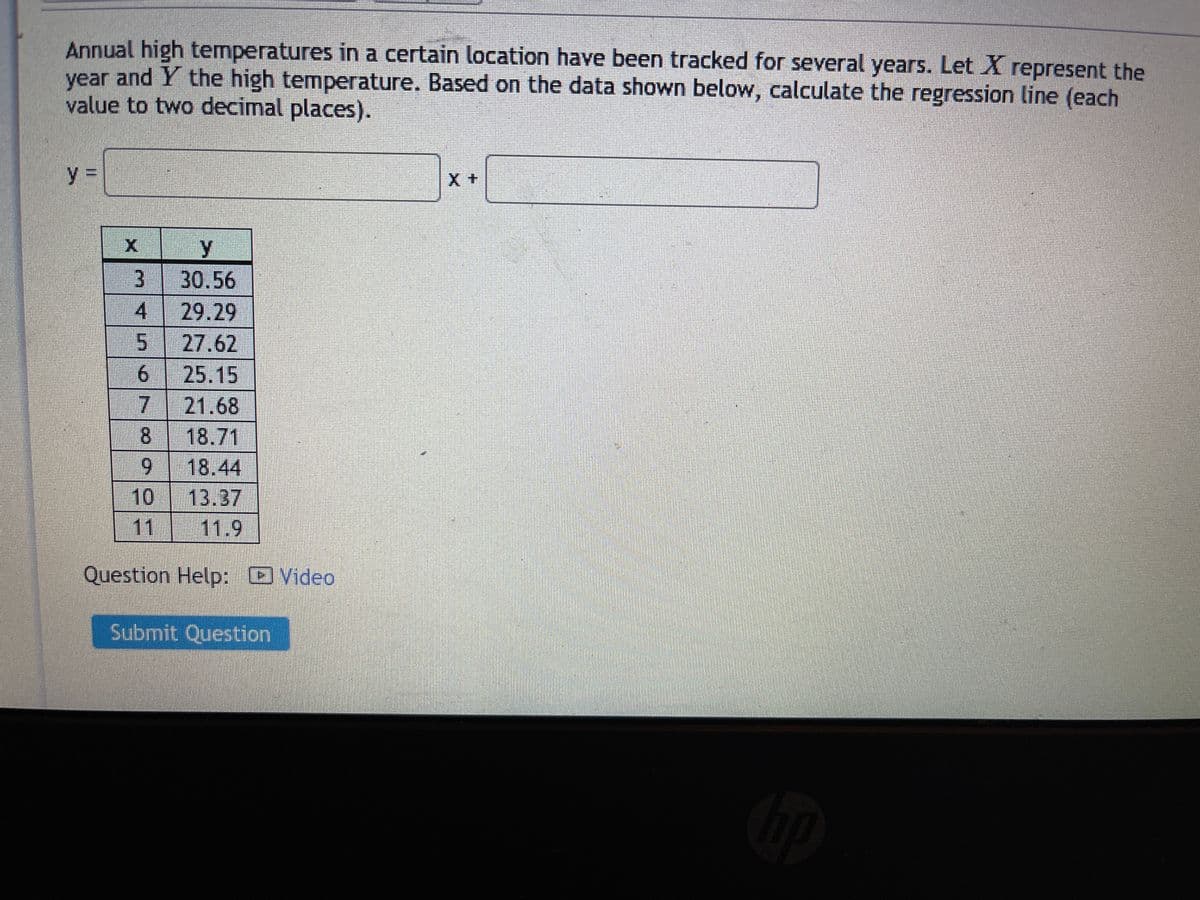
Annual high temperatures in a certain location have been tracked for several years. Let X represent the year and Y the high temperature. Based on the data shown below, calculate the regression line (each value to two decimal places). y = X + y 3. 30.56 29.29 27.62 25.15 21.68 8 18.71 18.44 10 13.37 11 11.9 4567 0oc


Q: Find the equation of the regression line for the given data. Then construct a scatter plot of the…
A: calculation procedure for regressionsum of (x) = ∑x = 840sum of (y) = ∑y = 2400sum of (x^2)= ∑x^2 =…
Q: (b) To assess balance, you run a series of bivariate regression models with all X variables as…
A: The p-value for the difference in all independent variable between treatment and control groups is…
Q: Fit a regression line to the data shown in the chart, and find the coefficient of correlation for…
A:
Q: Consider the data in the table on the right showing the average life expectancy of women in various…
A: Regression equation: y = mx+b
Q: The following table shows the average annual income in a certain country, adjusted for inflation,…
A:
Q: Find the equation of the regression line for the given data. Then construct a scatter plot of the…
A: Step-by-step procedure to find regression equation using Excel. 1.Firstly , you have to enter the…
Q: Annual high temperatures in a certain location have been tracked for several years. Let X represent…
A:
Q: Use the given data to find the equation of the regression line. Examine the scatterplot and identify…
A: Averages: x¯=∑i=1nXin=9911=9 y¯=∑i=1nYin=137.4211=12.4927
Q: Let y be the value of the dependent variable for observation i and let , be the predicted value of…
A: We have given that Yi be the value of the dependent variable for observation i and Yi^ be the…
Q: A researcher wants to predict weight from age, head width, and neck size. Which of the following is…
A: The slope value is -285.21.
Q: Use multiple linear regression to fit the following tabulated data: x1 4.5 6. 75 6. 12 x2 8.5 11…
A: For the given data Find Multiple regression equation is =? Standard error of estimate =? Correlation…
Q: Annual high temperatures in a certain location have been tracked for several years. Let X represent…
A:
Q: The following table shows the average annual income in a certain country, adjusted for inflation,…
A: Given :- The Table shows the annual income in a certain country , adjusted for inflation.
Q: The sales and profit of a clothing organization are represented in the table below. This given data…
A: Given:
Q: At a coach station, the maximum temperature in °C (x) and the number of bottles of water sold (y)…
A: There are two variables which are independent and dependent variables. The maximum temperature (x)…
Q: Q12. Identify the correct statement concerning, r the correlation coefficient between X and Y and…
A: The general form of the regression line is: Y=ax+b Where Y is the predicted value, 'b' is the…
Q: Calculate the estimated ‘Annual % ROI’ when the ‘Cost’ (X) is $160,000. Test the hypothesis: o…
A: Simple linear regression model: A simple linear regression model is given as y = b0 + bx, where y is…
Q: Annual high temperatures in a certain location have been tracked for several years. Let X represent…
A: Scatter plot:
Q: The personnel director of a large hospital is interested in determining the relationship (if any)…
A:
Q: Annual high temperatures in a certain location have been tracked for several years. Let X represent…
A: Given that Let X represent the year and Y the high temperature.... The data of X and Y is given in…
Q: Find the equation of the regression line for the given data. Then construct a scatter plot of the…
A: Use EXCEL to determine the regression equation. EXCEL procedure: Go to EXCEL Go to Data>Data…
Q: Annual high temperatures in a certain location have been tracked for several years. Let X represent…
A: Find Regression line equations from the following data X Y 3 1.24 4 2.92 5 4 6 4.28 7…
Q: Q9. Suppose that we took 7 mice and measured their body weight and their length from nose to tail.…
A: Given data: .
Q: Annual high temperatures in a certain location have been tracked for several years. Let and Y the…
A: X Y X×Y X×X 3 17.36 52.08 9 4 17.88 71.52 16 5 18.6 93 25 6 23.12 138.72 36 7 24.04 168.28…
Q: Find the equation of the regression line for the given data. Then construct a scatter plot of the…
A:
Q: Use the given data to find the equation of the regression line. Examine the scatterplot and identify…
A:
Q: Annual high temperatures in a certain location have been tracked for several years. Let XX represent…
A:
Q: Annual high temperatures in a certain location have been tracked for several years. Let XX represent…
A: Solution: Let X be the year and Y be the high temperature. From the given information,
Q: #26The quarterly sales data (number of copies sold) for a college textbook over the past three years…
A: Note:The forecast for a particular period can be obtained by substituting the necessary values of…
Q: The personnel director of a large hospital is interested in determining the relationship (if any)…
A: Solution To find the 99% prediction interval we will use Excel
Q: Run a regression analysis on the following data set, where y is the final grade in a math class and…
A: From given data, X Y X*Y X*X 5 43 215 25 8 71.2 569.6 64 9 71.6 644.4 81 12 72.8 873.6…
Q: An unknown metal has been found and the following experimental results have been tabulated in the…
A: (A) Use EXCEL to obtain the regression equation. EXCEL procedure: Go to EXCEL Go to…
Q: It is inferred that the tip amount has a relationship with value of a dinner bill. The collected…
A:
Q: Use the given data to find the equation of the regression line. Examine the scatterplot and identify…
A:
Q: An unknown metal has been found and the following experimental results have been tabulated in the…
A:
Q: Based on the data shown below, calculate the regression line (each value to at least two decimal…
A: Given data; x y x^2 y^2 x⋅y 4 17.56 16 308.3536 70.24 5 19.25 25 370.5625 96.25 6 22.04 36…
Q: Find the linear regression line for the following table of values. You will need to use a…
A: Solution:Straight line equation is y=a+bx.The normal equations are∑y=an+b∑x∑xy=a∑x+b∑x2The values…
Q: Annual high temperatures in a certain location have been tracked for several years. Let X represent…
A: The given data is x y 5 18.35 6 16.44 7 17.43 8 17.32 9 18.51 10 18.8 11 15.59…
Q: A random sample of ten professional athletes produced the following data where x is the number of…
A: Solution: Let X be the number of endorsements and Y be the amount of money made. The regression…
Q: Annual high temperatures in a certain location have been tracked for several years. Let X represent…
A: Solution
Q: Consider the following linear regression model: y with hat on top equals 0.55 x plus 1.69 The…
A: Formula for residual : Residual = Observed y - Predicted y Residual = y - y^
Q: Sarah has some data and wants to run a linear regression model on it. Before she runs the test, s-…
A: Given:
Q: b) A study is conducted to determine the relationship between a driver's age and the number of…
A: Given,
Q: Run a regression analysis on the following data set, where y is the final grade in a math class and…
A: In order to obtain the least square regression line, first perform regression analysis on the data.…
Q: Annual high temperatures in a certain location have been tracked for several years. Let XX represent…
A: The given data show the annual temperatures.
Q: Use the given data to find the best predicted value of the response variable. Six pairs of data…
A: GivenRegression equation is y^=4x-2y=19.0r=0.789
Q: Find the equation of the regression line for the given data. Then construct a scatter plot of the…
A:
Q: Demand for soccer balls at a new sporting goods store is forecasted using the following regression…
A: Given regression equation isy=98+2.2(x)
Q: Annual high temperatures in a certain location have been tracked for several years. Let X represent…
A: Given that The given problem is solved using excel regression Excel: data: data analysis:…
Q: Annual high temperatures in a certain location have been tracked for several years. Let X represent…
A: The standard form of linear regression equation is , where a is the intercept and b is the slope of…
Y= ______ X + ______

Step by step
Solved in 2 steps with 1 images


- Special Rounding Instructions For this exercise set, round all regression parameters to three decimal places, but round all other answers to two decimal places unless otherwise indicated. Postal RatesThe table below shows the cost s, in cents, of a domestic first-class postage stamp in the United States tyears after 1900. t=time,inyearssince1900 s=costofstamp 19 2 32 3 58 4 71 8 78 15 85 22 95 32 102 37 109 44 116 47 a.Use exponential regression to model s as an exponential function of t. b.What cost does your model give for a 1988 stamp? Report your answer to the nearest cent. The actual cost was 25cents. c.Plot the data and the exponential model.Special Rounding Instructions For this exercise set, round all regression parameters to three decimal places, but round all other answers to two decimal places unless otherwise indicated. Gray Wolves in WisconsinGray wolves were among the first mammals protected under the Endangered Species Act in the 1970s. Wolves recolonized in Wisconsin beginning in 1980.Their population grew reliably after 1985 as follows: Year Wolves Year Wolves 1985 15 1993 40 1986 16 1994 57 1987 18 1995 83 1988 28 1996 99 1989 31 1997 145 1990 34 1998 178 1991 40 1999 197 1992 45 2000 266 a. Explain why an exponential model may be appropriate. b. Are these data exactly exponential? Explain. c. Find an exponential model for these data. d. Plot the data and the exponential model. e. Comment on your graph in part d. Which data points are below or above the number predicted by the exponential model?Special Rounding Instructions. For this exercise set, round all regression parameters to three decimal places, but round all other answers to two decimal places unless otherwise indicated. Caloric Content Versus Shell Length In 1965, Robert T.Paine gathered data on the length L, in millimeters, of the shell and the caloric content C, in calories, for a certain mollusk. The table below is adapted from those data. L=length C=Calories 7.5 92 13 210 20 625 24 1035 31 1480 a.Find an exponential model of calories as a function of length. b.Plot the graph of the data and the exponential model. Which of the data points show a good deal less caloric content than the model would predict for the given length? c.If length is increased by 1millimeter, how is caloric content affected?
- Special Rounding Instructions. For this exercise set, round all regression parameters to three decimal places, but round all other answers to two decimal places unless otherwise indicated. Growth in Length of HaddockA study by Raitt showed that the maximum length that a haddock could be expected to grow is about 53centimeters.Let D=D(t) denote the difference between 53centimeters and the length at age t years. The table below gives experimentally collected values for D. Age t Difference D 2 28.2 5 16.1 7 9.5 13 3.3 19 1.0 a.Find an exponential model of D as a function of t. b.Let L=L(t) denote the length in centimeters of a haddock at age t years. Find the model for L as a function of t. c.Plot the graph of the experimentally gathered data for the length L at ages 2,5,7,13, and 19years along with the graph of the model you made for L. Does this graph show that the 5year old haddock is a bit shorter or a bit longer than would be expected? d.A fisherman has caught a haddock that measures 41centimeters. What is the approximate age of the haddock?Remainder Round all answers to two decimal places unless otherwise indicated. Gross Domestic Product U.S. gross domestic product, in trillions of dollars, is given in the table below. Date Gross domestic product 2010 15.0 2011 15.5 2012 16.2 2013 16.7 a.Find the equation of the regression line, and explain the meaning of its slope. Round regression line parameters to two decimal places. b.Plot the data points and the regression line. c.When would you predict that a gross domestic product of 17.3 trillion dollars would be reached? The actual gross domestic product in 2014 was 17.3 trillion dollars. What does that say about your prediction?A Dubious Model of Oil Prices The following table shows the prices of oil in U.S. dollars per barrel, t years since 1990, One analysis involving additional data used a cubic equation to model this data. t Years since 1990 0 2 5 7 10 12 15 17 20 21 P Price, dollars per barrel 18.91 16.22 16.63 18.20 27.04 23.47 49.63 69.04 77.46 106.92 a. Use cubic regression to model these data. Round the regression parameters to four decimal places. b. Plot the data along with the cubic model. c. In the analysis mentioned above, the graph is expanded through 2020. Expand the viewing window to show the model from 1990 to 2020. d. What estimate does the model give for oil prices in 2015? e. The actual price of oil in December of 2015 was about 35 per barrel. What basic principle in the use of models would be violated in relying on the estimate in part d?
- Special Rounding Instructions For this exercise set, round all regression parameters to three decimal places, but round all other answers to two decimal places unless otherwise indicated. Design Patents The following table shows the number P of design patents awarded by the U.S. Patents and Trademark Office from 1950 through 2010. t = years since 1950 P = patents 0 4718 10 2543 20 3214 30 3949 40 8024 50 17,413 60 22,799 a.Use exponential regression to model P as a function of t. b.Plot the data along with the regression equation. c.In what years were there more patents awarded than might be expected from the model?Zipfs Law The following table shows U.S cities by rank in terms of population and population in thousands. City Rank r Population N New York 1 8491 Chicago 3 2722 Philadelphia 5 1560 Dallas 9 1280 Austin 11 913 San Francisco 13 852 Columbus 15 836 A rule known as Zipfs law tells us that it is reasonable to approximate these data with a power function. a Use power regression to express the population as a function of the rank. b Plot the data along with the power function from part a. c Phoenix is the sixth largest city in the United States. Use your answer from part a to estimate population of Phoenix. Round your answer in thousands to the nearest whole number. Note: The actual population is 1537 thousand.Special Rounding Instructions For this exercise set, round all regression parameters to three decimal places, but round all other answers to two decimal places unless otherwise indicated. Atmospheric Pressure The table below gives a measurement of atmospheric pressure, in grams per square centimeter, at the given altitude, in kilometers. Altitude Atmospheric Pressure 5 569 10 313 15 172 20 95 25 52 For comparison, 1 kilometer is about 0.6 mile, and 1 gram per square centimeter is about 2 pounds per square foot. a.Plot the data on atmospheric pressure. b.Make an exponential model for the data on atmospheric pressure. c.What is the atmospheric pressure at an altitude of 30 kilometers? d.Find the atmospheric pressure on Earths surface. This is termed standard atmospheric pressure. e.At what altitude is the atmospheric pressure equal to 25 of standard atmospheric pressure?
- Noise and Intelligibility Audiologists study the intelligibility of spoken sentences under different noise levels. Intelligibility, the MRT score, is measured as the percent of a spoken sentence that the listener can decipher at a cesl4ain noise level in decibels (dB). The table shows the results of one such test. (a) Make a scatter plot of the data. (b) Find and graph the regression line. (c) Find the correlation coefficient. Is a linear model appropriate? (d) Use the linear model in put (b) to estimate the intelligibility of a sentence at a 94-dB noise level.A simple linear regression model was used to describe the relationship between y = hardness of molded plastic and x = amount of time elapsed since the end of the molding process. Summary quantities included n = 16, SSResid = 1235.470, and SSTo = 25,221.368. (a) Calculate an estimate of ?. (Round your answer to three decimal places.) What value for degrees of freedom is associated with this estimate? (b) What percentage of observed variation in hardness can be explained by the linear relationship between hardness and elapsed time? (Round your answer to one decimal place.) _____%A sample consists of 500 houses sold in Karachi between January 2020 and December 2020. The multiple linear regression analysis is carried out to predict the house prices for investment in residential properties in Karachi, Pakistan. The output below is produced using SPSS. Model Unstandardized Coefficients t VIF Constant 14.208 5.736 Age of house -0.299 -2.322 1.58 Square footage of the house 0.364 2.931 1.71 Income of families in the area 0.004 0.392 1.01 Transportation time to major markets -0.337 -2.619 1.90, R2 = 0.67; DW = 2.08 How would you interpret the above ‘Output’ of a regression analysis performed in SPSS?

