Answer the following questions referring to the MINITAB simulation of confidence intervals given in the photo below" In theory, how many of the intervals would you expect to contain the true population mean U ( = 10)? How many of the intervals actually contain the mean of the population? If this simulation were repeated would you always find that the same number of intervals contain U?
Answer the following questions referring to the MINITAB simulation of confidence intervals given in the photo below" In theory, how many of the intervals would you expect to contain the true population mean U ( = 10)? How many of the intervals actually contain the mean of the population? If this simulation were repeated would you always find that the same number of intervals contain U?

MATLAB: An Introduction with Applications
6th Edition
ISBN:9781119256830
Author:Amos Gilat
Publisher:Amos Gilat
Chapter1: Starting With Matlab
Section: Chapter Questions
Problem 1P

Related questions
Question
Question 2: Answer the following questions referring to the MINITAB simulation of confidence intervals given in the photo below"
- In theory, how many of the intervals would you expect to contain the true population
mean U ( = 10)? - How many of the intervals actually contain the mean of the population?
- If this simulation were repeated would you always find that the same number of intervals contain U?
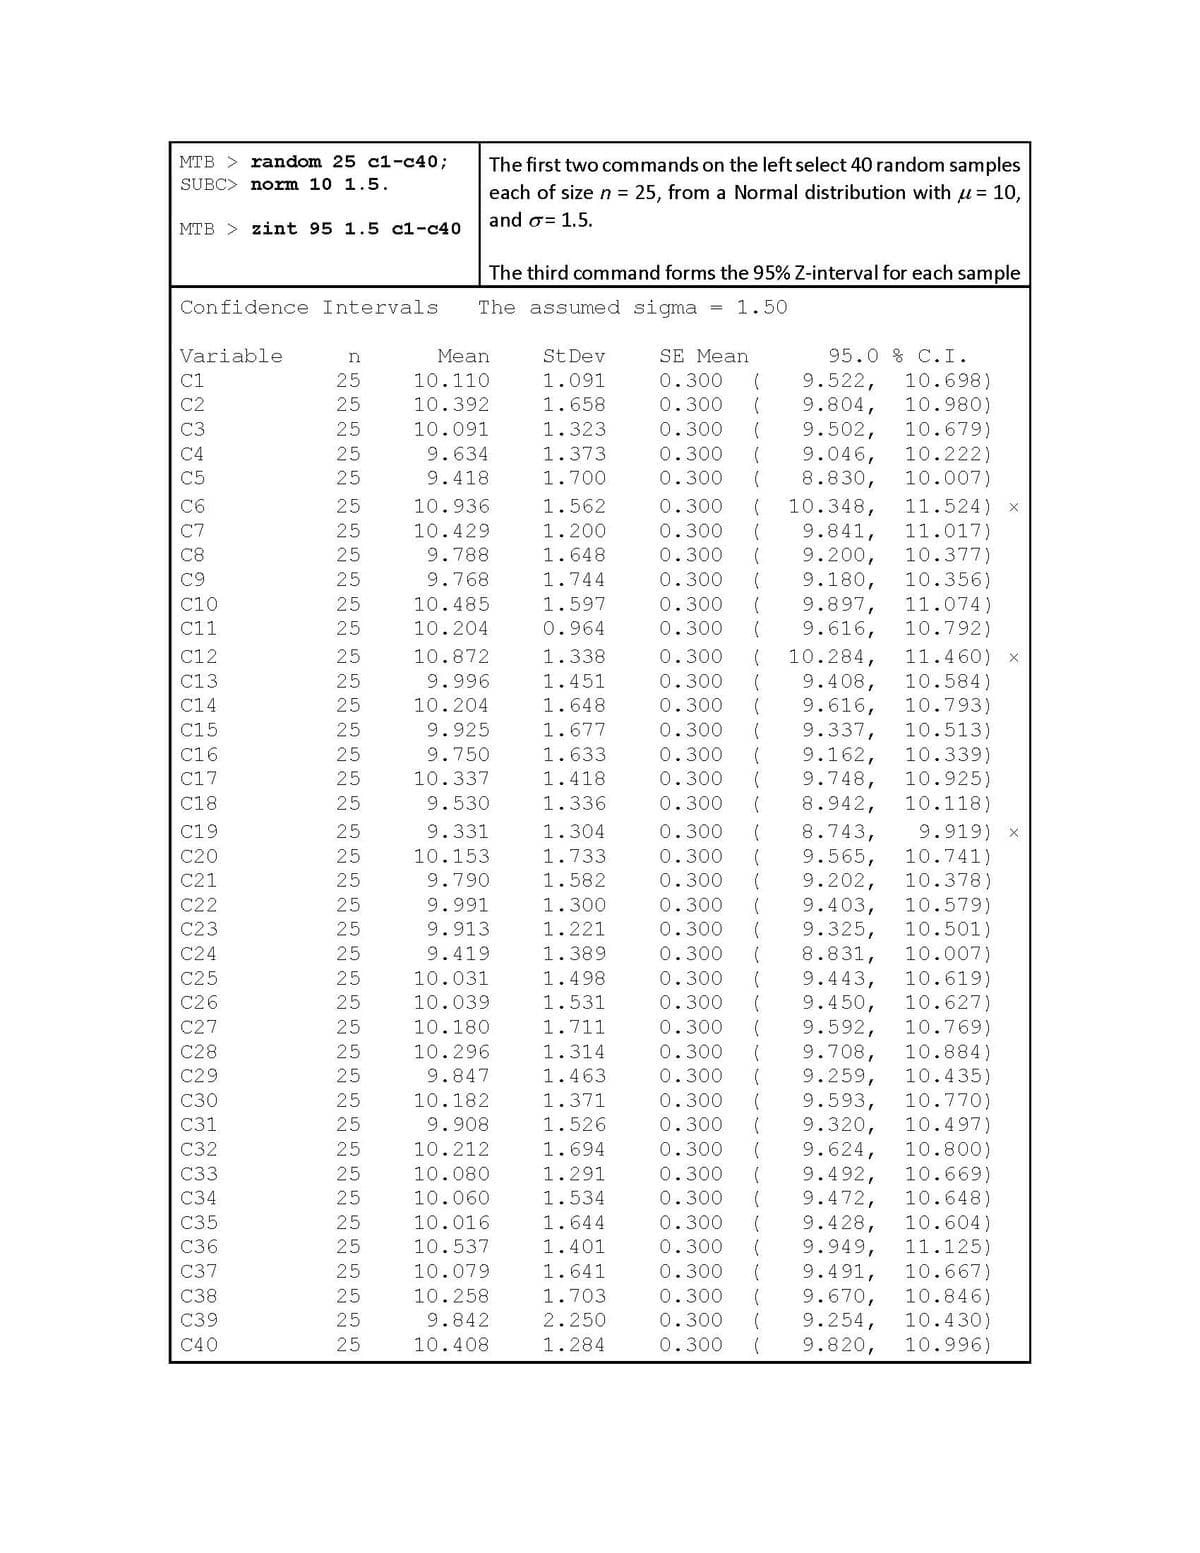
Transcribed Image Text:MTB
random 25 c1-c40;
The first two commands on the left select 40 random samples
each of size n = 25, from a Normal distribution with u = 10,
SUBC> norm 10 1.5.
and o= 1.5.
МТВ
zint 95 1.5 c1-c40
The third command forms the 95% Z-interval for each sample
Confidence Intervals
The assumed sigma
1.50
Variable
n
Mean
St Dev
SE Mean
95.0 % C.I.
10.698)
10.980)
9.522,
9.804,
9.502,
9.046,
8.830,
C1
10.110
1.091
0.300
C2
25
10.392
1.658
0.300
10.679)
10.222)
10.007)
25
10.091
1.323
0.300
25
9.634
1.373
0.300
25
9.418
1.700
0.300
25
10.936
1.562
0.300
10.348,
11.524) x
10.429
0.300
11.017)
10.377)
10.356)
25
1.200
9.841,
9.200,
9.180,
9.897,
9.616,
25
9.788
1.648
0.300
25
9.768
1.744
0.300
C10
25
10.485
1.597
0.300
11.074)
C11
25
10.204
0.964
0.300
10.792)
10.284,
9.408,
9.616,
9.337,
9.162,
9.748,
8.942,
0.300
11.460) x
10.584)
10.793)
C12
25
10.872
1.338
C13
25
9.996
1.451
0.300
C14
25
10.204
1.648
0.300
C15
25
9.925
1.677
0.300
10.513)
C16
25
9.750
1.633
0.300
10.339)
C17
25
10.337
1.418
0.300
10.925)
C18
25
9.530
1.336
0.300
10.118)
C19
25
9.331
1.304
0.300
8.743,
9.565,
9.202,
9.403,
9.325,
8.831,
9.443,
9.450,
9.592,
9.708,
9.259,
9.593,
9.320,
9.624,
9.492,
9.472,
9.428,
9.949,
9.491,
9.919) x
10.741)
10.378)
C20
25
10.153
1.733
0.300
C21
25
9.790
1.582
0.300
C22
25
9.991
1.300
0.300
10.579)
C23
25
9.913
1.221
0.300
10.501)
10.007)
C24
25
9.419
1.389
0.300
C25
25
10.031
1.498
0.300
10.619)
10.627)
10.769)
10.884)
C26
25
10.039
1.531
0.300
C27
25
10.180
1.711
0.300
C28
25
10.296
1.314
0.300
C29
25
9.847
1.463
0.300
10.435)
10.182
0.300
10.770)
10.497)
C30
25
1.371
C31
9.908
1.526
0.300
C32
25
10.212
1.694
0.300
10.800)
10.669)
10.648)
10.604)
11.125)
C33
25
10.080
1.291
0.300
C34
25
10.060
1.534
0.300
C35
25
10.016
1.644
0.300
C36
25
10.537
1.401
0.300
C37
25
10.079
1.641
0.300
10.667)
10.258
1.703
0.300
10.846)
9.670,
9.254,
9.820,
C38
10.430)
10.996)
C39
25
9.842
2.250
0.300
C40
25
10.408
1.284
0.300
E LO LO LO
LO LO LO LO
N N N N N N N N N N N
Expert Solution
This question has been solved!
Explore an expertly crafted, step-by-step solution for a thorough understanding of key concepts.

Step by step
Solved in 2 steps

Knowledge Booster


Learn more about
Need a deep-dive on the concept behind this application? Look no further. Learn more about this topic, statistics and related others by exploring similar questions and additional content below.Recommended textbooks for you
MATLAB: An Introduction with Applications
Statistics
ISBN:
9781119256830
Author:
Amos Gilat
Publisher:
John Wiley & Sons Inc

Probability and Statistics for Engineering and th…
Statistics
ISBN:
9781305251809
Author:
Jay L. Devore
Publisher:
Cengage Learning

Statistics for The Behavioral Sciences (MindTap C…
Statistics
ISBN:
9781305504912
Author:
Frederick J Gravetter, Larry B. Wallnau
Publisher:
Cengage Learning
MATLAB: An Introduction with Applications
Statistics
ISBN:
9781119256830
Author:
Amos Gilat
Publisher:
John Wiley & Sons Inc
Probability and Statistics for Engineering and th…
Statistics
ISBN:
9781305251809
Author:
Jay L. Devore
Publisher:
Cengage Learning
Statistics for The Behavioral Sciences (MindTap C…
Statistics
ISBN:
9781305504912
Author:
Frederick J Gravetter, Larry B. Wallnau
Publisher:
Cengage Learning

Elementary Statistics: Picturing the World (7th E…
Statistics
ISBN:
9780134683416
Author:
Ron Larson, Betsy Farber
Publisher:
PEARSON

The Basic Practice of Statistics
Statistics
ISBN:
9781319042578
Author:
David S. Moore, William I. Notz, Michael A. Fligner
Publisher:
W. H. Freeman

Introduction to the Practice of Statistics
Statistics
ISBN:
9781319013387
Author:
David S. Moore, George P. McCabe, Bruce A. Craig
Publisher:
W. H. Freeman