Antisocial personality disorder (ASPD) is characterized by deceitfulness, reckless disregard for the well-being of others, a diminished capacity for remorse, superficial charm, thrill seeking, and poor behavioral control. ASPD is not normally diagnosed in children or adolescents, but antisocial tendencies can sometimes be recognized in childhood or early adolescence. James Blair and his colleagues have studied the ability of children with antisocial tendencies to recognize facial expressions that depict sadness, happiness, anger, disgust, fear, and surprise. They have found that childre with antisocial tendencies have selective impairments, with significantly more difficulty recognizing fearful and sad expressions. Suppose you have a sample of 35 14-year-old children with antisocial tendencies and you are particularly interested in the emotion of surprise. The average 14-year-old has a score on the emotion recognition scale of 13.10. (The higher the score on this scale, the more strongly an emotion has to be displayed to be correctly identified. Therefore, higher scores indicate greater difficulty recognizing the emotion). Assume that scores on the emotion recognition scale are normally distributed. You believe that children with antisocial tendencies will have a harder time recognizing the emotion of surprise (in other words, they will have higher scores on the emotion recognition test). What is your null hypothesis stated using symbols? What is your alternative hypothesis stated using symbols? This is a tailed test. Given what you know, you will evaluate this hypothesis using a statistic. Using the Distributions tool, locate the critical region for a = 0.05. t Distribution Degrees of Freedom-33 -3.0 -2.0 -1.0 0.0 1.0 2.0 3.0 In order to use the t distribution, you will first need to determine the degrees of freedom (df) for a - 0.05. The degrees of freedom (dt) is The critical value of t is Your sample of 14-year-old children with antisocial tendencies has an average score of 14.35 with a standard deviation of 4.63.
Antisocial personality disorder (ASPD) is characterized by deceitfulness, reckless disregard for the well-being of others, a diminished capacity for remorse, superficial charm, thrill seeking, and poor behavioral control. ASPD is not normally diagnosed in children or adolescents, but antisocial tendencies can sometimes be recognized in childhood or early adolescence. James Blair and his colleagues have studied the ability of children with antisocial tendencies to recognize facial expressions that depict sadness, happiness, anger, disgust, fear, and surprise. They have found that childre with antisocial tendencies have selective impairments, with significantly more difficulty recognizing fearful and sad expressions. Suppose you have a sample of 35 14-year-old children with antisocial tendencies and you are particularly interested in the emotion of surprise. The average 14-year-old has a score on the emotion recognition scale of 13.10. (The higher the score on this scale, the more strongly an emotion has to be displayed to be correctly identified. Therefore, higher scores indicate greater difficulty recognizing the emotion). Assume that scores on the emotion recognition scale are normally distributed. You believe that children with antisocial tendencies will have a harder time recognizing the emotion of surprise (in other words, they will have higher scores on the emotion recognition test). What is your null hypothesis stated using symbols? What is your alternative hypothesis stated using symbols? This is a tailed test. Given what you know, you will evaluate this hypothesis using a statistic. Using the Distributions tool, locate the critical region for a = 0.05. t Distribution Degrees of Freedom-33 -3.0 -2.0 -1.0 0.0 1.0 2.0 3.0 In order to use the t distribution, you will first need to determine the degrees of freedom (df) for a - 0.05. The degrees of freedom (dt) is The critical value of t is Your sample of 14-year-old children with antisocial tendencies has an average score of 14.35 with a standard deviation of 4.63.

MATLAB: An Introduction with Applications
6th Edition
ISBN:9781119256830
Author:Amos Gilat
Publisher:Amos Gilat
Chapter1: Starting With Matlab
Section: Chapter Questions
Problem 1P

Related questions
Question
11 please help with all parts
Transcribed Image Text:+
ng
gage.com/static/nb/ui/evo/index.html?deploymentld=589573224712048206244311922&EISBN=9780357035108&id%3D12501
CENGAGE MINDTAP
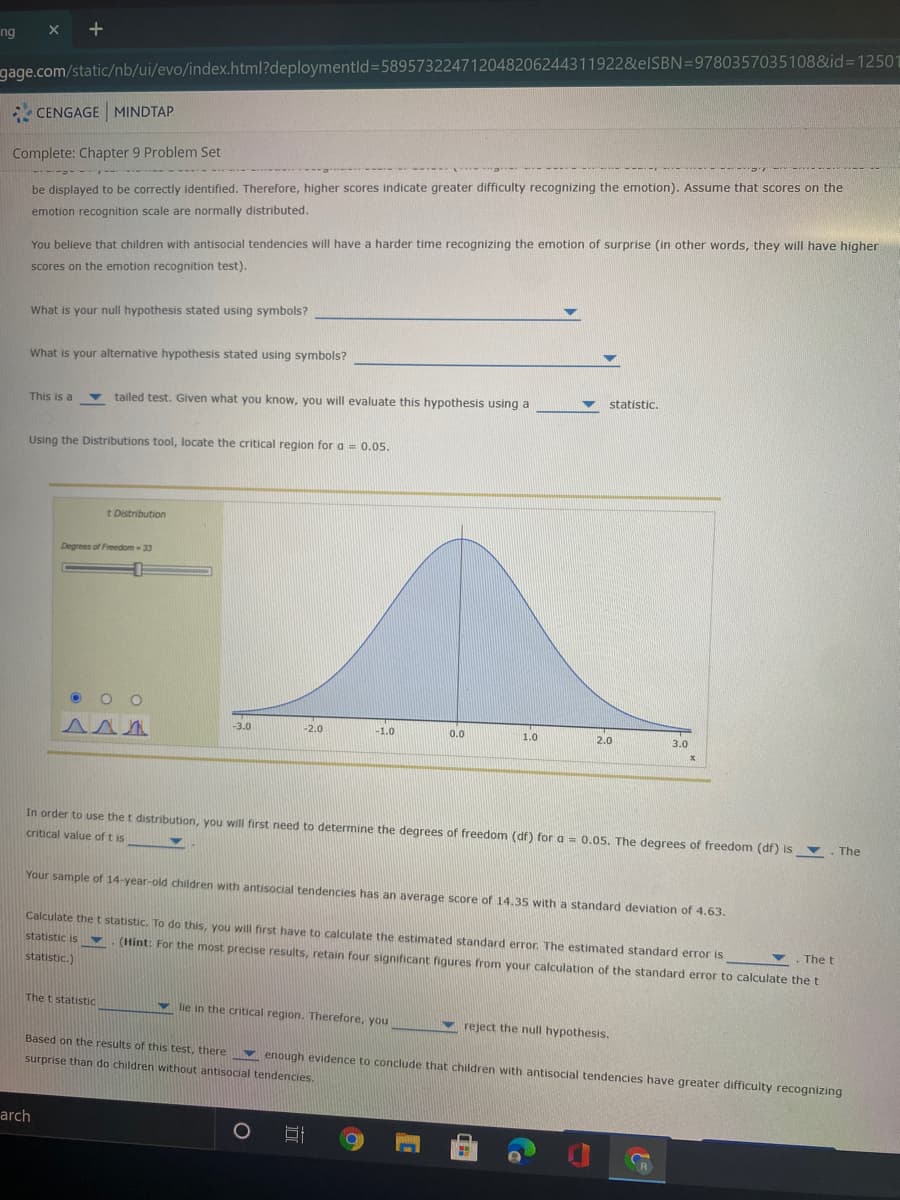
Complete: Chapter 9 Problem Set
be displayed to be correctly identified. Therefore, higher scores indicate greater difficulty recognizing the emotion). Assume that scores on the
emotion recognition scale are normally distributed.
You believe that children with antisocial tendencies will have a harder time recognizing the emotion of surprise (in other words, they will have higher
scores on the emotion recognition test).
What is your null hypothesis stated using symbols?
What is your alternative hypothesis stated using symbols?
This is a
tailed test. Given what you know, you will evaluate this hypothesis using a
statistic.
Using the Distributions tool, locate the critical region for a = 0.05.
t Distribution
Degrees of Freedom- 33
-3.0
-2.0
-1.0
0.0
1.0
2.0
3.0
In order to use the t distribution, you will first need to determine the degrees of freedom (df) for a = 0.05. The degrees of freedom (df) is . The
critical value of t is
Your sample of 14-year-old children with antisocial tendencies has an average score of 14.35 with a standard deviation of 4.63.
Calculate thet statistic. To do this, you will first have to calculate the estimated standard error. The estimated standard error is
statistic is Y
.The t
(Hint: For the most precise results, retain four significant figures from your calculation of the standard error to calculate the t
statistic.)
The t statistic
v lie in the critical region. Therefore, you
reject the null hypothesis.
Based on the results of this test, there v enough evidence to conclude that children with antisocial tendencies have greater difficulty recognizing
surprise than do children without antisocial tendencies.
arch
Transcribed Image Text:Complete: Chapter 9 Problem Set
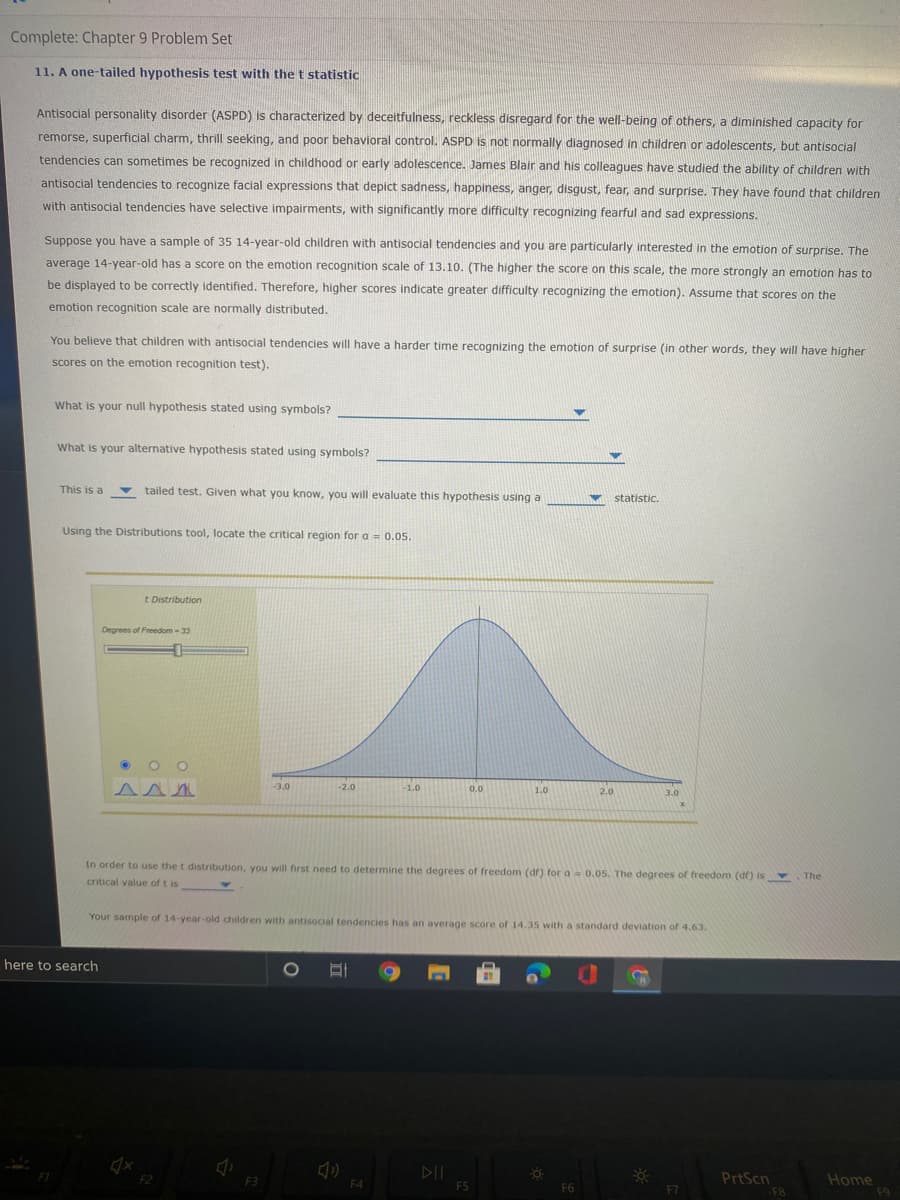
11. A one-tailed hypothesis test with the t statistic
Antisocial personality disorder (ASPD) is characterized by deceitfulness, reckless disregard for the well-being of others, a diminished capacity for
remorse, superficial charm, thrill seeking, and poor behavioral control. ASPD is not normally diagnosed in children or adolescents, but antisocial
tendencies can sometimes be recognized in childhood or early adolescence. James Blair and his colleagues have studied the ability of children with
antisocial tendencies to recognize facial expressions that depict sadness, happiness, anger, disgust, fear, and surprise. They have found that children
with antisocial tendencies have selective impairments, with significantly more difficulty recognizing fearful and sad expressions.
Suppose you have a sample of 35 14-year-old children with antisocial tendencies and you are particularly interested in the emotion of surprise. The
average 14-year-old has a score on the emotion recognition scale of 13.10. (The higher the score on this scale, the more strongly an emotion has to
be displayed to be correctly identified. Therefore, higher scores indicate greater difficulty recognizing the emotion). Assume that scores on the
emotion recognition scale are normally distributed.
You believe that children with antisocial tendencies will have a harder time recognizing the emotion of surprise (in other words, they will have higher
scores on the emotion recognition test).
What is your null hypothesis stated using symbols?
What is your alternative hypothesis stated using symbols?
This is a
tailed test. Given what you know, you will evaluate this hypothesis using a
statistic.
Using the Distributions tool, locate the critical region for a 0.05.
t Distribution
Degrees of Freedom - 33
-3.0
-2.0
-1.0
0.0
1.0
2.0
3.0
In order to use the t distribution, you will first need to determine the degrees of freedom (df) for a 0.05. The degrees of freedom (df) is
s
The
critical value of t is
Your sample of 14-year-old children with antisocial tendencies has an average score of 14.35 with a standard deviation of 4.63.
here to search
DII
FS
PrtScn
F8
F2
Home
F9
F3
F4
F6
F7
Expert Solution
This question has been solved!
Explore an expertly crafted, step-by-step solution for a thorough understanding of key concepts.

This is a popular solution!

Trending now
This is a popular solution!

Step by step
Solved in 2 steps with 4 images

Recommended textbooks for you
MATLAB: An Introduction with Applications
Statistics
ISBN:
9781119256830
Author:
Amos Gilat
Publisher:
John Wiley & Sons Inc

Probability and Statistics for Engineering and th…
Statistics
ISBN:
9781305251809
Author:
Jay L. Devore
Publisher:
Cengage Learning

Statistics for The Behavioral Sciences (MindTap C…
Statistics
ISBN:
9781305504912
Author:
Frederick J Gravetter, Larry B. Wallnau
Publisher:
Cengage Learning
MATLAB: An Introduction with Applications
Statistics
ISBN:
9781119256830
Author:
Amos Gilat
Publisher:
John Wiley & Sons Inc
Probability and Statistics for Engineering and th…
Statistics
ISBN:
9781305251809
Author:
Jay L. Devore
Publisher:
Cengage Learning
Statistics for The Behavioral Sciences (MindTap C…
Statistics
ISBN:
9781305504912
Author:
Frederick J Gravetter, Larry B. Wallnau
Publisher:
Cengage Learning

Elementary Statistics: Picturing the World (7th E…
Statistics
ISBN:
9780134683416
Author:
Ron Larson, Betsy Farber
Publisher:
PEARSON

The Basic Practice of Statistics
Statistics
ISBN:
9781319042578
Author:
David S. Moore, William I. Notz, Michael A. Fligner
Publisher:
W. H. Freeman

Introduction to the Practice of Statistics
Statistics
ISBN:
9781319013387
Author:
David S. Moore, George P. McCabe, Bruce A. Craig
Publisher:
W. H. Freeman