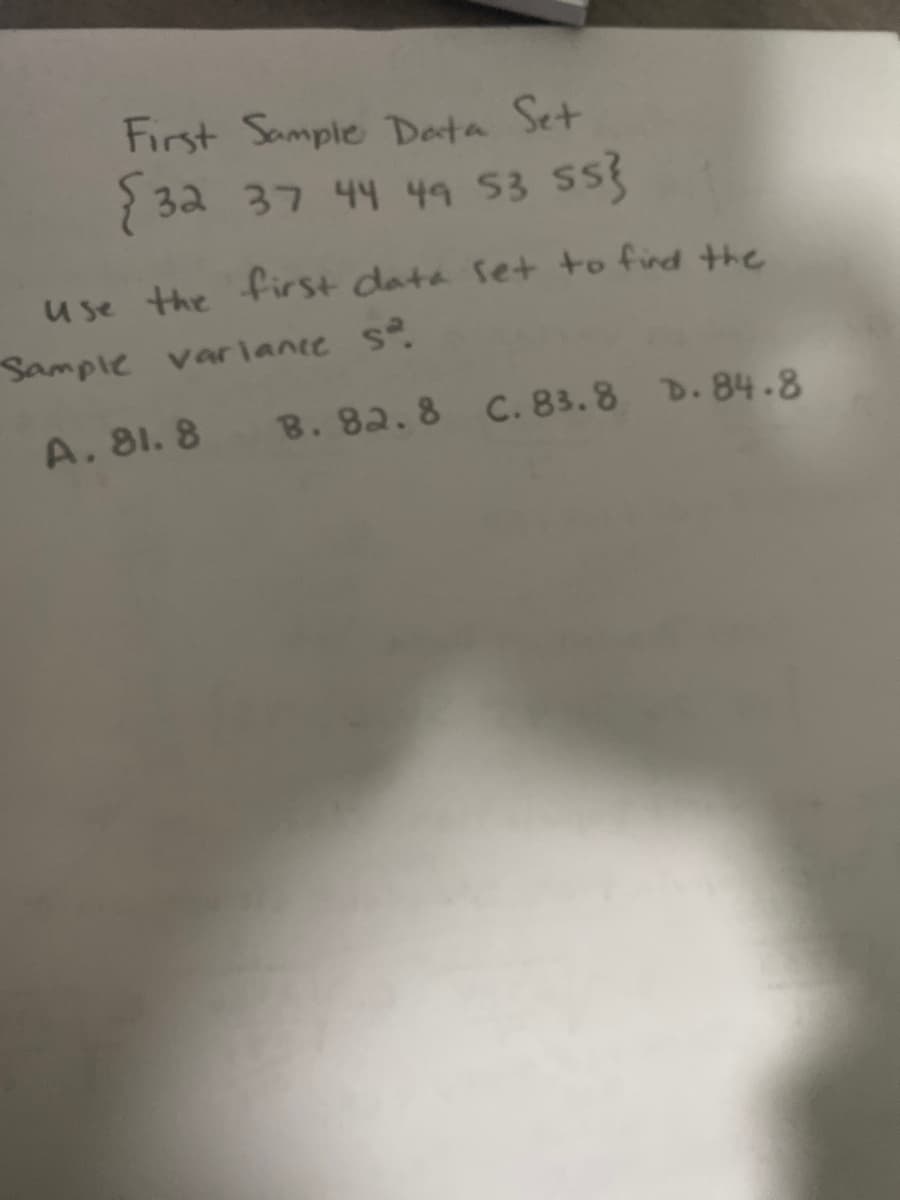
First Sample Deta {32 37 44 49 53 sS first data set to find the


Q: 6. Are America's top chief executive officers (CEOS) really worth all that money? Öne way to answer…
A: We will use a paired t-test to test whether there is difference between the mean percentage increase…
Q: The time (in seconds) that it took for each of 16 vehicles to exit a parking lot in downtown…
A:
Q: Three admission test preparation programs are being evaluated. Suppose the scores obtained by a…
A: Given information: The data represents the test scores of 3 programs A, B and C.
Q: Bootstrap Sample Given the sample data from Exercise 2, which of the following are not possible…
A: Bootstrap sample:In the bootstrap method, the sample should be taken from the original sample with…
Q: A single sample t-test should be conducted to see if there is a difference between which of the…
A: A single sample t-test A single sample t-test is used to see there is a difference between sample…
Q: 10 8 4 1 11 16 21 26 31 data Based on the histogram above, what is the class width? Class width =…
A:
Q: a. Identify the population for the study. b. Identify the sample for the study. c. Was this an…
A: Since you have posted a question with multiple sub-parts, we will solve first three sub-parts for…
Q: In statistics, data points Do not mean a sampling Mean total number of cases in a Mean total number…
A: We have given that a statement about a data point in statistics. Here we need to tell what does it…
Q: n this population data : (1, 2, 3, 4) what is the Standard Error when a sample size of 3 is drawn.
A: Here use standard error formula with finite population
Q: Descriptive Statistics Section Sample Data Setmo 92 38 br 38 43 56 76 1 1. Use the Sample Data Set.…
A: Sample mean gives central tendency of the given dataset. Sample mean is denoted by x¯.
Q: Population or Sample? A.) SJS Travel Agency, a nationwide local travel special rates on summer…
A: It is sample.
Q: Variable N Y 9 Mean 19.96 SE Mean ? Std. Dev. 3.12 Variance ? Minimum 15.94 Maximum 27.16
A: Given: N = 9 Mean μ = 19.96 Standard deviation σ = 3.12 Minimum = 15.94 Maximum = 27.16 Formula…
Q: Assume that you want to test the claim that the paired sample data come from a population for which…
A:
Q: Test the claim the samples come from populations with the same mean. Use a.05 significance level.…
A: Given : Significance level = 0.05
Q: 8 6 1 5 9 13 17 21 25 data Based on the histogram above, what is the class width? Class width = What…
A: A histogram is a graphical representation of numerical observations.
Q: During last semester Calculus Il final exam, a random sample of students grades are as follows: 2 25…
A: Given data, 2,25,30,45,50,56,62,75,83,90,92 Sample mean=?
Q: A random sample of employees participating in a company fitness program were asked how many days…
A: Class width=Upper limit- lower limit
Q: 8 6 Frequency A N 16 21 26 31 data Based on the histogram above, what is the class width? 1 6 Class…
A:
Q: 10+ 8. 4- 2 1 6 11 16 data 21 26 31 Based on the histogram above, what is the class width? Class…
A: Determine the class width. The class width is obtained below as follows: From the given…
Q: ere is an archaeological study area located in southwestern New Mexico. Potsherds are broken pieces…
A: Part (a): Hypotheses: That is, there is no significant difference between the population means of…
Q: To increase the Power of a test: I. II. Increase the Significance Level. Decrease the sample size.…
A: An assumption regarding a population parameter is tested using hypothesis test.
Q: find variance of data sample size n = 8 52,56,57,50,59,60,61,59
A:
Q: 1. For the sample data set (1,2,6} find a. Er b. Σ 2 c Σ (3) d. Σ(-3): 2. For the sample data set…
A: Hey, since there are multiple questions posted, we will answer first question. If you want any…
Q: The variance of one sample (22 regions) = 14.29. (a=0.01) (10')
A: Given, The hypothesis to be tested is given as follows: This is a two-tailed test.
Q: 32. You are given n = 5 measurements 2, 1,1, 3, 5. Find the sample standard deviation.
A:
Q: 10+ 8 6. 1 3 5 7 data 9 11 13 Based on the histogram above, what is the class (bin) width? Class…
A: In the histogram, each block is called a class. The width of each block is called the class width.…
Q: brewe average of 122 ounce beer is used to ana rocess, the bottler takes a random sample of 16…
A: Given, test statistic (t) = -1.259 population mean (µ) = 12 sample size(n) = 16 degree of freedom…
Q: 10+ 8 1 4 7 10 13 16 19 data Based on the histogram above, what is the class width? Class width =…
A: Solution:- From above Histogram , it is clear that class width = 4-1= 3
Q: A null hypothesis states that p%=.3, the observed sample proportion is p=.41 with a sample size of…
A:
Q: Construct all random samples consisting two observations from the given data. You are asked to guess…
A: total watermelon=6 out of 2 can be selected without replacement. Hence all possible samples =6C2=15…
Q: II. A population consist of numbers 2,4,6,8,10,12 and 14 with a sampling distribution of 5. 3. Find…
A: Mean is the measure of central tendency. It is calculated by adding all the measure and divided by…
Q: Exercise 7.1 The lengths of time, in minutes, that 10 patients waited in a doctor's office before…
A:
Q: Ho:p = 0.64 H1:p < 0.64 Your sample consists of 114 subjects, with 72 successes. Calculate the test…
A: We have given that, H0 : p = 0.64 vs H1 : p < 0.64 Where p is the population proportion p= 0.64…
Q: Lightning Deaths Refer to the sample data in Cumulative Review Exercise 1. a. What is the level of…
A: In this case, Cumulative review Exercise 1 is considered as follows:
Q: Test the claim about the population mean μ at the level of significance α. Assume the population is…
A:
Q: (a) Find the standard error of the mean for each sampling situation (assuming a normal population).…
A: Formula to find standard error : SE = σn
Q: Complete the sentence: As the sample size n increases, A the standard error and the margin of error…
A:
Q: A random experiment involves drawing a sample of 12 data values from a normally distributed…
A: Given data is,49, 57, 58, 58,64, 67, 69, 7172, 74, 76, 82
Q: I1. A field of study contains 14,204 men and 17,811 women. A survey stratified with respect to…
A: Given Information: Number of men = 14204 Number of women = 17811 The sample size (n) = 750…
Q: decrease the sample size. crease the sample size. ecrease the sample size. idence interval. meeded.)…
A: * Hi! Thank you for the question, As per the honour code, we are allowed to answer three sub-parts…
Q: You have a population mean µ=27, and a sample mean of 29. The sample variance equals 6. Compute…
A: The rejection of a null hypothesis indicates that an effect is significant. The effect of a…
Q: College Board provided comparisons of Scholastic Aptitude Test (SAT) scores based on the highest…
A: Solution: Let x= College grades and y = Highschool grades. n1=16 Sample size of college…
Q: tics (BLS) administer the American Time Use Survey (ATUS). Researchers estimate the average amount…
A: Given data: 1.2 4.8 1.4 4.4 3.8 2.2 4.6 0.9 2.5 1.5 1 3.5
Q: Weight( w;) 3.4 3.0 3 3.5 1 2.0 a. Compute the weighted mean (to 3 decimals). b. Compute the sample…
A:
Q: You are conducting a test of homogeneity for the claim that two different populations have the same…
A: The marginal totals are calculated as follows: Category Population #1 Population #2 Total A 35…
Q: Ho:p = 0.49 H1:p > 0.49 Your sample consists of 147 subjects, with 68 successes. Calculate the test…
A: It is given that sample size (n) is 147 and x is 68.
Q: A Sample sIze 25 is pie pom a pith a ogean of 100 population wh an 99
A: mean = 100 variance = 36 standard deviation = 6 n = 25
Q: 10+ 4 1 9. 13 17 21 25 data Based on the histogram above, what is the class width? Class width = %3D…
A:
Q: A researcher is interested in the texting habits of high schools students in the United States. The…
A: A statistic is a numerical data obtained from a sample. Note: If the data were obtained from the…

Step by step
Solved in 2 steps with 1 images
