S-adenosyl methionine (SAM-e) is a naturally occurring compound in human cells that is thought to have an effect on depression symptoms. Suppose that a researcher is interested in testing SAM-e on patients who are struggling with cancer. She obtains a sample of n = 20 patients and asks each person to take the suggested dosage each day for 4 weeks. At the end of the 4-week period, each individual takes the Beck Depression Inventory (BDI), which is a 21-item, multiple-choice self-report inventory for measuring the severity of depression. The scores from the sample produced a mean of M = 24.4 with a standard deviation ofs = 6.02. In the general population of cancer patients, the standardized test is known to have a population mean of u = 27.2. Because there are no previous studies using SAM-e with this population, the researcher doesn't know how it will affect these patients; therefore, she uses a two-tailed single-sample t test to test the hypothesis. From the following, select the correct null and alternative hypotheses for this study: O Ho: PSAM-e = 27.2; Hs: PSAMe 27.2 O Ho: MSAMe 2 27.2; Hs: MSAMe> 27.2 O He: PSAM-e S 27.2; H: USAMe> 27.2 O He: PSAM-e 2 27.2; Hs: PSAMe < 27.2 Assume that the depression scores among patients taking SAM-e are normally distributed. You will first need to determine the degrees of freedom. There are v degrees of freedom. Use the t distribution table to find the critical region for a- 0.01. The t Distribution: Proportion in One Tail
S-adenosyl methionine (SAM-e) is a naturally occurring compound in human cells that is thought to have an effect on depression symptoms. Suppose that a researcher is interested in testing SAM-e on patients who are struggling with cancer. She obtains a sample of n = 20 patients and asks each person to take the suggested dosage each day for 4 weeks. At the end of the 4-week period, each individual takes the Beck Depression Inventory (BDI), which is a 21-item, multiple-choice self-report inventory for measuring the severity of depression. The scores from the sample produced a mean of M = 24.4 with a standard deviation ofs = 6.02. In the general population of cancer patients, the standardized test is known to have a population mean of u = 27.2. Because there are no previous studies using SAM-e with this population, the researcher doesn't know how it will affect these patients; therefore, she uses a two-tailed single-sample t test to test the hypothesis. From the following, select the correct null and alternative hypotheses for this study: O Ho: PSAM-e = 27.2; Hs: PSAMe 27.2 O Ho: MSAMe 2 27.2; Hs: MSAMe> 27.2 O He: PSAM-e S 27.2; H: USAMe> 27.2 O He: PSAM-e 2 27.2; Hs: PSAMe < 27.2 Assume that the depression scores among patients taking SAM-e are normally distributed. You will first need to determine the degrees of freedom. There are v degrees of freedom. Use the t distribution table to find the critical region for a- 0.01. The t Distribution: Proportion in One Tail

MATLAB: An Introduction with Applications
6th Edition
ISBN:9781119256830
Author:Amos Gilat
Publisher:Amos Gilat
Chapter1: Starting With Matlab
Section: Chapter Questions
Problem 1P

Related questions
Question
6
Transcribed Image Text:6. Two-tailed hypothesis testing - Step by step
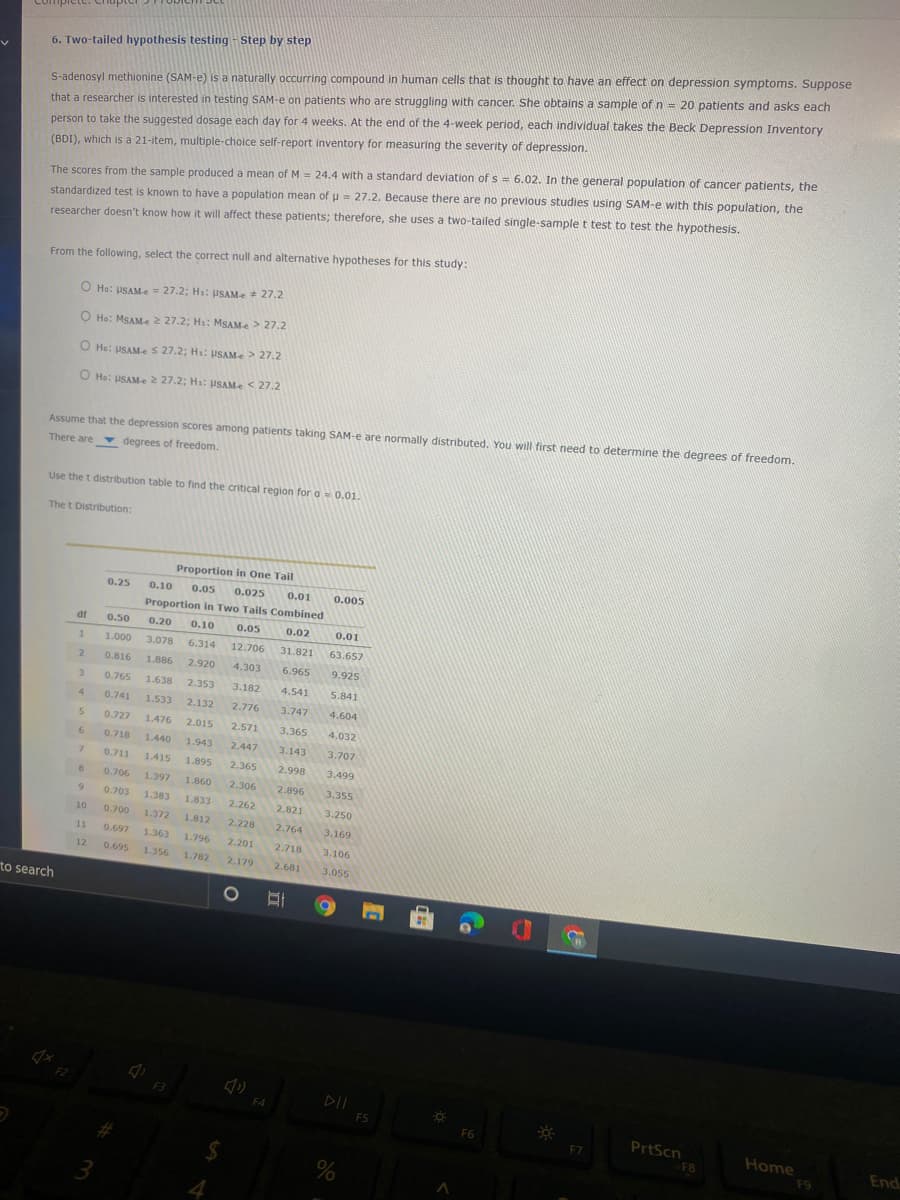
S-adenosyl methionine (SAM-e) is a naturally occurring compound in human cells that is thought to have an effect on depression symptoms. Suppose
that a researcher is interested in testing SAM-e on patients who are struggling with cancer. She obtains a sample of n = 20 patients and asks each
person to take the suggested dosage each day for 4 weeks. At the end of the 4-week period, each individual takes the Beck Depression Inventory
(BDI), which is a 21-item, multiple-choice self-report inventory for measuring the severity of depression.
The scores from the sample produced a mean of M = 24.4 with a standard deviation of s = 6.02. In the general population of cancer patients, the
standardized test is known to have a population mean of u = 27.2. Because there are no previous studies using SAM-e with this population, the
researcher doesn't know how it will affect these patients; therefore, she uses a two-tailed single-sample t test to test the hypothesis.
From the following, select the correct null and alternative hypotheses for this study:
O Ho: USAM-e = 27.2; H: usAMe 27.2
O Ho: MSAMe 2 27.2; Hs: MSAMe> 27.2
O He: USAMe S 27.2; Hi: USAMe> 27.2
O He: USAM-e 2 27.2; H: PSAMe < 27.2
Assume that the depression scores among patients taking SAM-e are normally distributed. You will first need to determine the degrees of freedom.
There are degrees of freedom.
Use the t distribution table to find the critical region for a- 0.01.
The t Distribution:
Proportion in One Tail
0.25
0.10
0.05
0.025
0.01
0.005
Proportion in Two Tails Combined
df
0.50
0.20
0.10
0.05
0.02
0.01
1.000
3.078
6.314
12.706
31.821
63.657
2.
0.816
1.886
2.920
4.303
6.965
9.925
3.
0.765
1.638
2.353
3.182
4.541
5.841
4.
0.741
1.533
2.132
2.776
3.747
4.604
0.727
1.476
2.015
2.571
3.365
4.032
6
0.718
1.440
1.943
2.447
3.143
3.707
7.
0.711
1.415
1.895
2.365
2.998
3.499
0.706
1.397
1.860
2.306
2.896
3.355
0.703
1.383
1.833
2.262
2.821
3.250
10
0.700
1.372
1.812
2.228
2.764
3.169
1
0.697
1.363
1.796
2.201
2.718
3.106
12
0.695
1.356
1.782
2.179
2.681
3.055
to search
F3
DII
F4
F5
PrtScn
F8
F6
F7
Home
End
F9
3
4.
Ca
Transcribed Image Text:3.143
3.707
1.943
2.447
0.718
1.440
2.365
2.998
3.499
1.415
1.895
7.
0.711
2.896
3.355
0.706
1.397
1.860
2.306
8.
2.262
2.821
3.250
0.703
1.383
1.833
9.
2.228
2.764
3.169
10
0.700
1.372
1.812
2.201
2.718
3.106
11
0.697
1.363
1.796
1.782
2.179
2.681
3.055
12
0.695
1.356
0.694
1.350
1.771
2.160
2.650
3.012
13
0.692
1.345
1.761
2.145
2.624
2.977
14
15
0.691
1.341
1.753
2.131
2.602
2.947
16
0.690
1.337
1.746
2.120
2.583
2.921
17
0.689
1.333
1.740
2.110
2.567
2.898
18
0.688
1.330
1.734
2.101
2.552
2.878
19
0.688
1.328
1.729
2.093
2.539
2.861
20
0.687
1.325
1.725
2.086
2.528
2.845
21
0.686
1.323
1.721
2.080
2.518
2.831
22
0.686
1.321
1.717
2.074
2.508
2.819
23
0.685
1.319
1.714
2.069
2.500
2.807
24
0.685
1.318
1.711
2.064
2.492
2.797
25
0.684
1.316
1.708
2.060
2.485
2.787
26
0.684
1.315
1.706
2.056
2.479
2.779
27
0.684
1.314
1.703
2.052
2.473
2.771
28
0.683
1.313
1.701
2.048
2.467
2.763
29
0.683
1.311
1.699
2.045
2.462
2.756
30
0.683
1.310
1.697
2.042
2.457
2.750
40
0.681
1.303
1.684
2.021
2.423
2.704
60
0.679
1.296
1.671
2.000
2.390
120
0.677
2.660
1.289
1.658
1.980
2.358
2.617
00
0.674
1.282
1.645
1.960
2.326
2.576
2,576
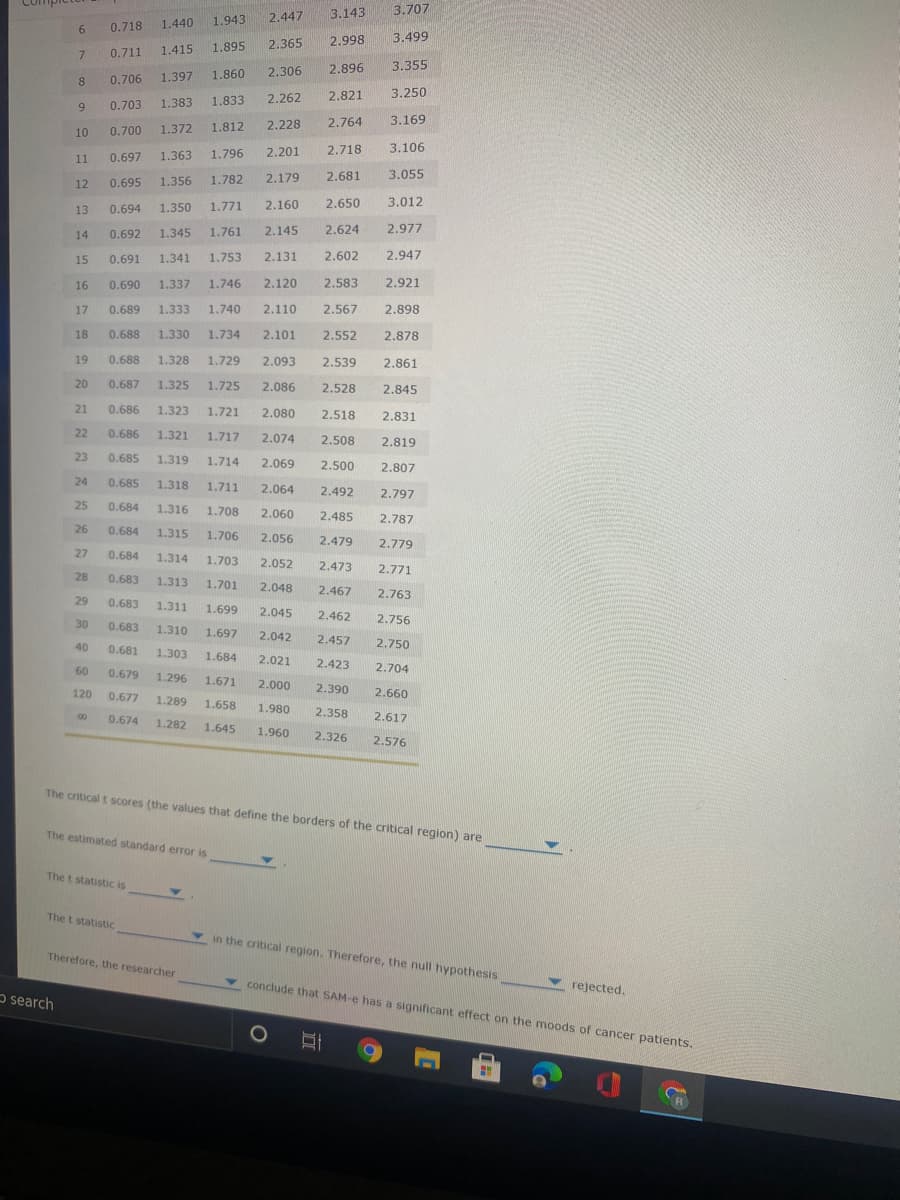
The critical t scores (the values that define the borders of the critical region) are
The estimated standard error is
The t statistic is
The t statistic
in the critical region. Therefore, the null hypothesis
Therefore, the researcher
conclude that SAM-e has a significant effect on the moods of cancer patients.
rejected.
O search
R
Expert Solution
This question has been solved!
Explore an expertly crafted, step-by-step solution for a thorough understanding of key concepts.

This is a popular solution!

Trending now
This is a popular solution!

Step by step
Solved in 2 steps with 2 images

Recommended textbooks for you
MATLAB: An Introduction with Applications
Statistics
ISBN:
9781119256830
Author:
Amos Gilat
Publisher:
John Wiley & Sons Inc

Probability and Statistics for Engineering and th…
Statistics
ISBN:
9781305251809
Author:
Jay L. Devore
Publisher:
Cengage Learning

Statistics for The Behavioral Sciences (MindTap C…
Statistics
ISBN:
9781305504912
Author:
Frederick J Gravetter, Larry B. Wallnau
Publisher:
Cengage Learning
MATLAB: An Introduction with Applications
Statistics
ISBN:
9781119256830
Author:
Amos Gilat
Publisher:
John Wiley & Sons Inc
Probability and Statistics for Engineering and th…
Statistics
ISBN:
9781305251809
Author:
Jay L. Devore
Publisher:
Cengage Learning
Statistics for The Behavioral Sciences (MindTap C…
Statistics
ISBN:
9781305504912
Author:
Frederick J Gravetter, Larry B. Wallnau
Publisher:
Cengage Learning

Elementary Statistics: Picturing the World (7th E…
Statistics
ISBN:
9780134683416
Author:
Ron Larson, Betsy Farber
Publisher:
PEARSON

The Basic Practice of Statistics
Statistics
ISBN:
9781319042578
Author:
David S. Moore, William I. Notz, Michael A. Fligner
Publisher:
W. H. Freeman

Introduction to the Practice of Statistics
Statistics
ISBN:
9781319013387
Author:
David S. Moore, George P. McCabe, Bruce A. Craig
Publisher:
W. H. Freeman