Arandom sample of 1/ observations taken from a population that is normally distributed produced a sample mean of 42.4 anda standard deviation of 8. Find the range for the p-value and the critical and observed values of t for each of the following tests
Arandom sample of 1/ observations taken from a population that is normally distributed produced a sample mean of 42.4 anda standard deviation of 8. Find the range for the p-value and the critical and observed values of t for each of the following tests

MATLAB: An Introduction with Applications
6th Edition
ISBN:9781119256830
Author:Amos Gilat
Publisher:Amos Gilat
Chapter1: Starting With Matlab
Section: Chapter Questions
Problem 1P

Related questions

Topic Video
Question
I added these two problems together because i thought since i only need help with one part of the random sample 17 i can myself another question help. I can't find the critical value for it. I tried -2.583 and 2.583 and my professor says it still wrong. If this problem can be specified on how to get it exactly with the correct answer it will be gladly appreciated
the other problem i need help with the 3 empty boxes.
please and thank you
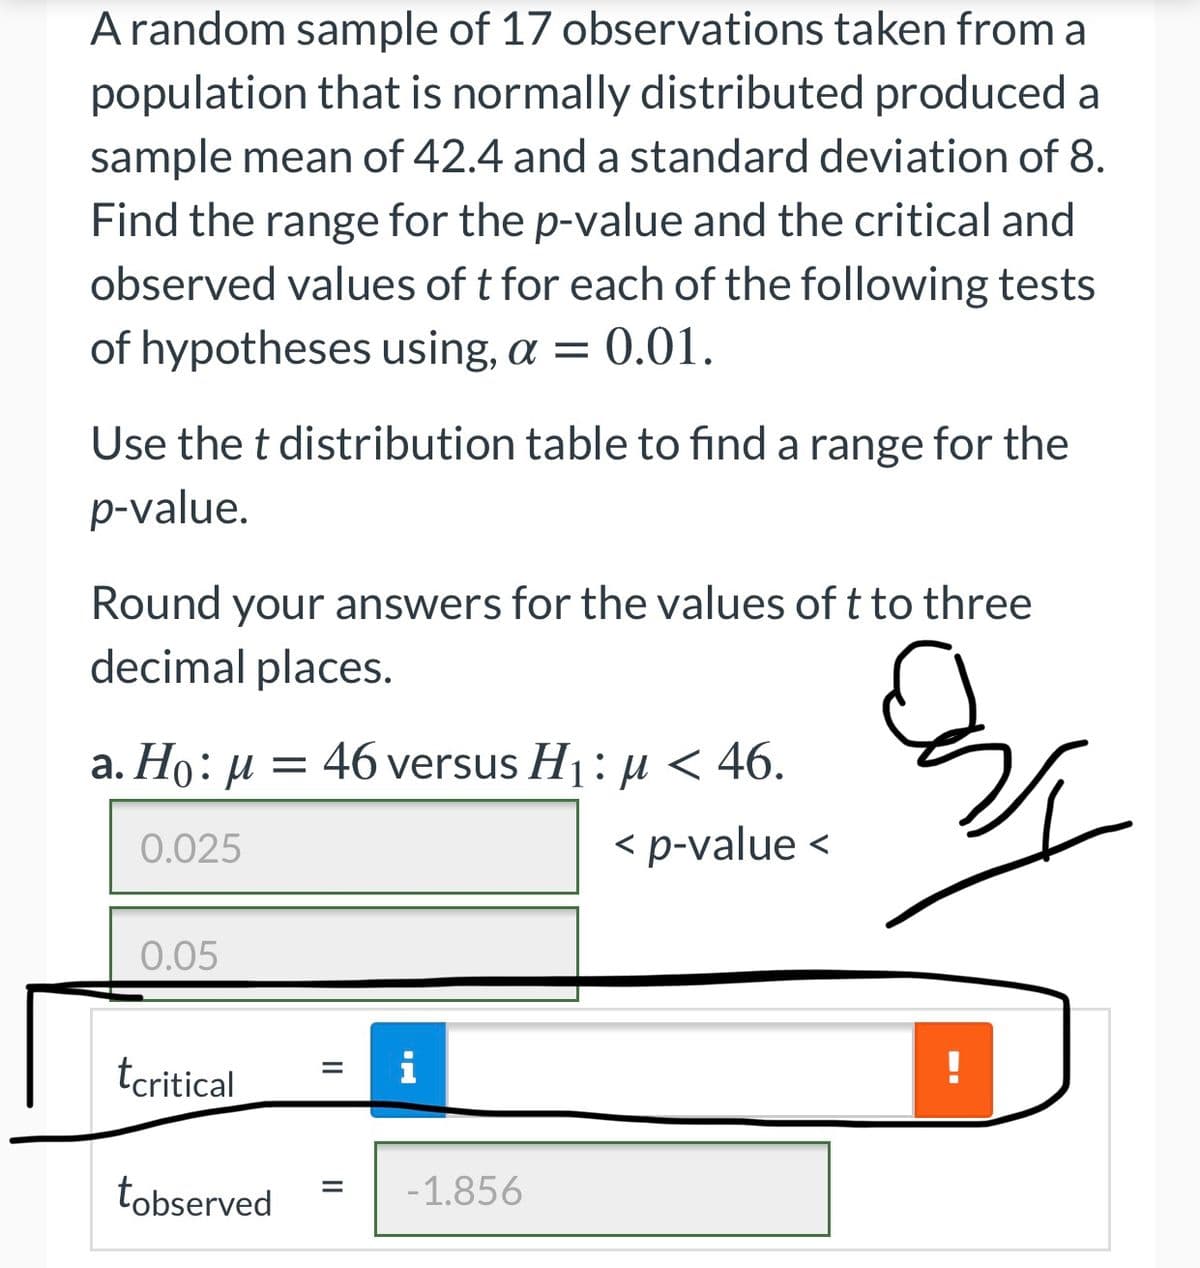
Transcribed Image Text:Arandom sample of 17 observations taken from a
population that is normally distributed produced a
sample mean of 42.4 and a standard deviation of 8.
Find the range for the p-value and the critical and
observed values of t for each of the following tests
of hypotheses using, a = 0.01.
Use the t distribution table to find a range for the
p-value.
Round your answers for the values of t to three
decimal places.
a. Ho: µ = 46 versus H1: µ < 46.
46 versus H1:µ < 46.
0.025
< p-value <
0.05
tcritical
tobserved
-1.856
II
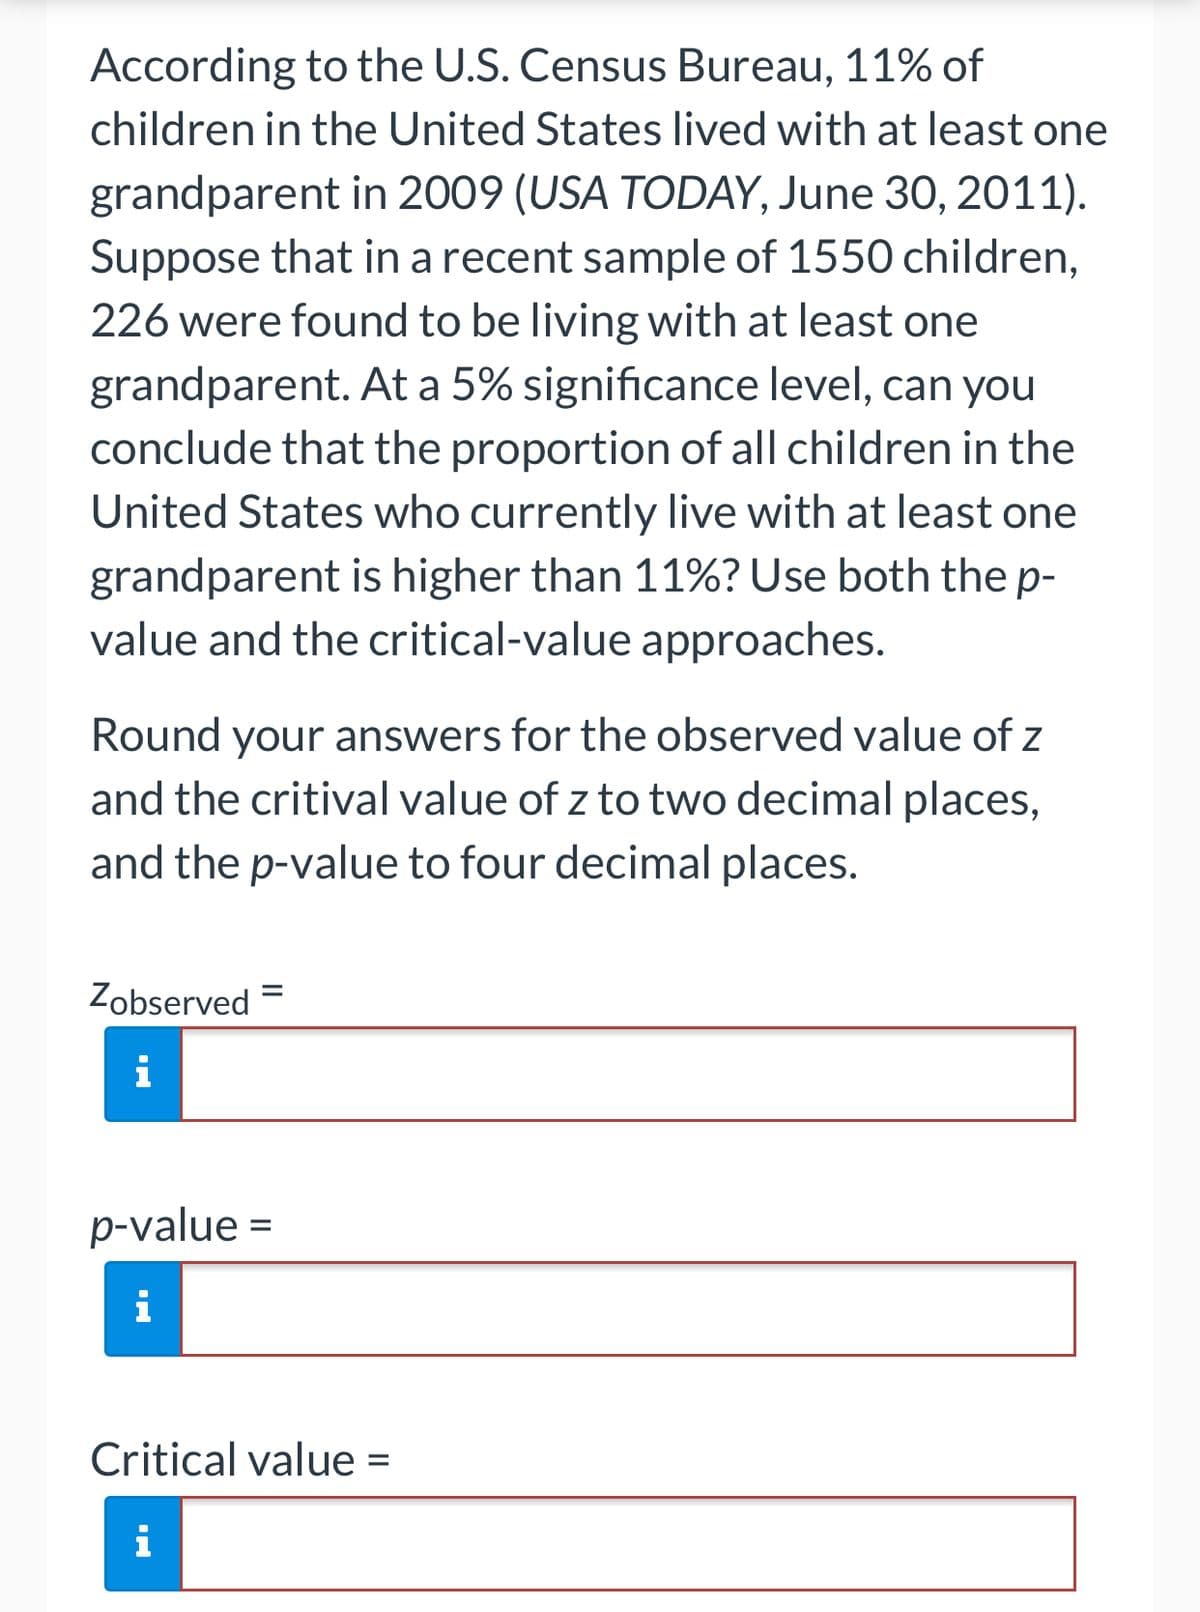
Transcribed Image Text:According to the U.S. Census Bureau, 11% of
children in the United States lived with at least one
grandparent in 2009 (USA TODAY, June 30, 2011).
Suppose that in a recent sample of 1550 children,
226 were found to be living with at least one
grandparent. At a 5% significance level, can you
conclude that the proportion of all children in the
United States who currently live with at least one
grandparent is higher than 11%? Use both the p-
value and the critical-value approaches.
Round your answers for the observed value of z
and the critival value of z to two decimal places,
and the p-value to four decimal places.
Zobserved =
i
p-value =
%3D
i
Critical value =
i
Expert Solution
Step 1
As per the honor code, We’ll answer the first question since the exact one wasn’t specified. Please submit a new question by specifying the one you’d like answered in the remaining questions
Given,
To find,
t critical value.

Trending now
This is a popular solution!

Step by step
Solved in 2 steps with 1 images

Knowledge Booster


Learn more about
Need a deep-dive on the concept behind this application? Look no further. Learn more about this topic, statistics and related others by exploring similar questions and additional content below.Recommended textbooks for you
MATLAB: An Introduction with Applications
Statistics
ISBN:
9781119256830
Author:
Amos Gilat
Publisher:
John Wiley & Sons Inc

Probability and Statistics for Engineering and th…
Statistics
ISBN:
9781305251809
Author:
Jay L. Devore
Publisher:
Cengage Learning

Statistics for The Behavioral Sciences (MindTap C…
Statistics
ISBN:
9781305504912
Author:
Frederick J Gravetter, Larry B. Wallnau
Publisher:
Cengage Learning
MATLAB: An Introduction with Applications
Statistics
ISBN:
9781119256830
Author:
Amos Gilat
Publisher:
John Wiley & Sons Inc
Probability and Statistics for Engineering and th…
Statistics
ISBN:
9781305251809
Author:
Jay L. Devore
Publisher:
Cengage Learning
Statistics for The Behavioral Sciences (MindTap C…
Statistics
ISBN:
9781305504912
Author:
Frederick J Gravetter, Larry B. Wallnau
Publisher:
Cengage Learning

Elementary Statistics: Picturing the World (7th E…
Statistics
ISBN:
9780134683416
Author:
Ron Larson, Betsy Farber
Publisher:
PEARSON

The Basic Practice of Statistics
Statistics
ISBN:
9781319042578
Author:
David S. Moore, William I. Notz, Michael A. Fligner
Publisher:
W. H. Freeman

Introduction to the Practice of Statistics
Statistics
ISBN:
9781319013387
Author:
David S. Moore, George P. McCabe, Bruce A. Craig
Publisher:
W. H. Freeman