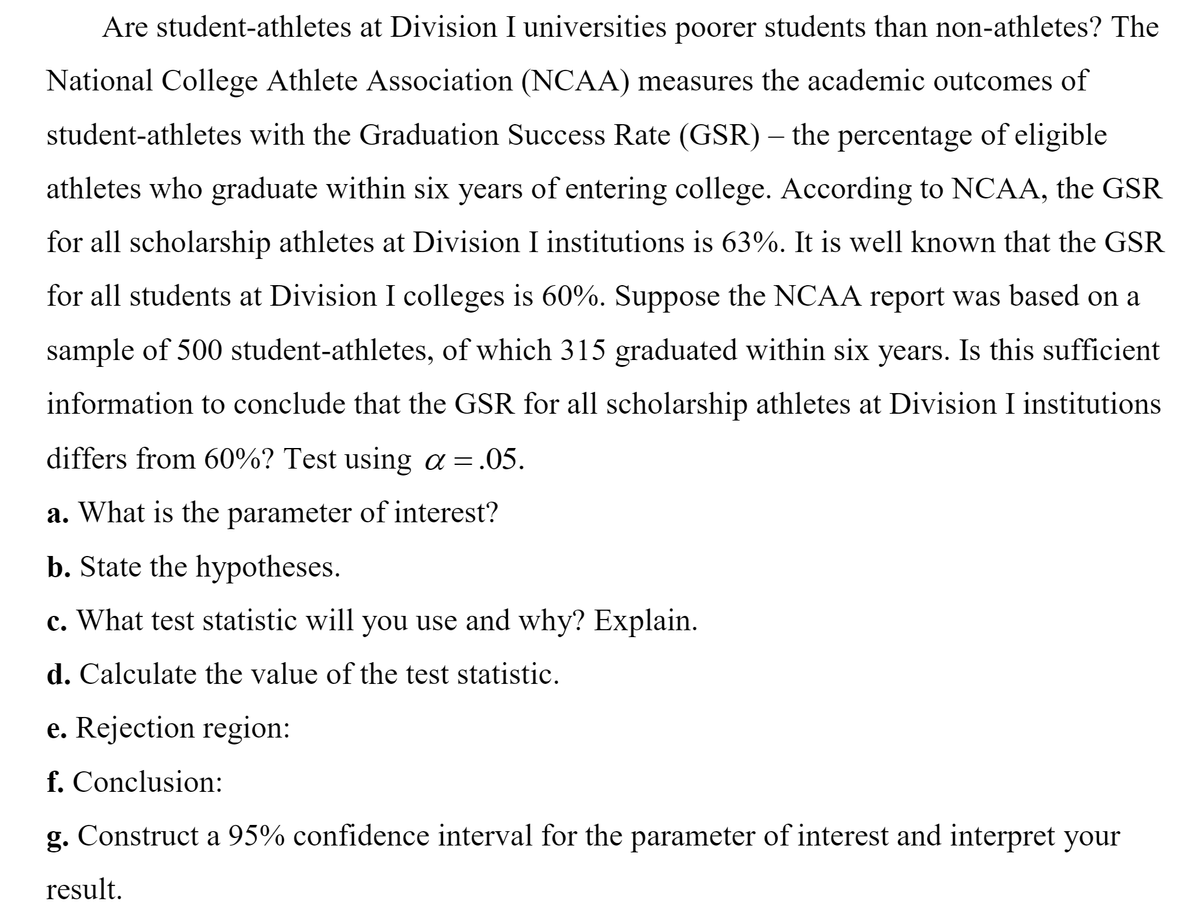
Are student-athletes at Division I universities poorer students than non-athletes? The National College Athlete Association (NCAA) measures the academic outcomes of student-athletes with the Graduation Success Rate (GSR) – the percentage of eligible athletes who graduate within six years of entering college. According to NCAA, the GSR for all scholarship athletes at Division I institutions is 63%. It is well known that the GSR for all students at Division I colleges is 60%. Suppose the NCAA report was based on a sample of 500 student-athletes, of which 315 graduated within six years. Is this sufficient information to conclude that the GSR for all scholarship athletes at Division I institutions differs from 60%? Test using a =.05. a. What is the parameter of interest? b. State the hypotheses. c. What test statistic will you use and why? Explain. d. Calculate the value of the test statistic. e. Rejection region: f. Conclusion: g. Construct a 95% confidence interval for the parameter of interest and interpret your
Are student-athletes at Division I universities poorer students than non-athletes? The National College Athlete Association (NCAA) measures the academic outcomes of student-athletes with the Graduation Success Rate (GSR) – the percentage of eligible athletes who graduate within six years of entering college. According to NCAA, the GSR for all scholarship athletes at Division I institutions is 63%. It is well known that the GSR for all students at Division I colleges is 60%. Suppose the NCAA report was based on a sample of 500 student-athletes, of which 315 graduated within six years. Is this sufficient information to conclude that the GSR for all scholarship athletes at Division I institutions differs from 60%? Test using a =.05. a. What is the parameter of interest? b. State the hypotheses. c. What test statistic will you use and why? Explain. d. Calculate the value of the test statistic. e. Rejection region: f. Conclusion: g. Construct a 95% confidence interval for the parameter of interest and interpret your

Glencoe Algebra 1, Student Edition, 9780079039897, 0079039898, 2018
18th Edition
ISBN:9780079039897
Author:Carter
Publisher:Carter
Chapter10: Statistics
Section10.6: Summarizing Categorical Data
Problem 10CYU

Related questions
Topic Video
Question
Please help by providing detailed explanation to answers. Thanks
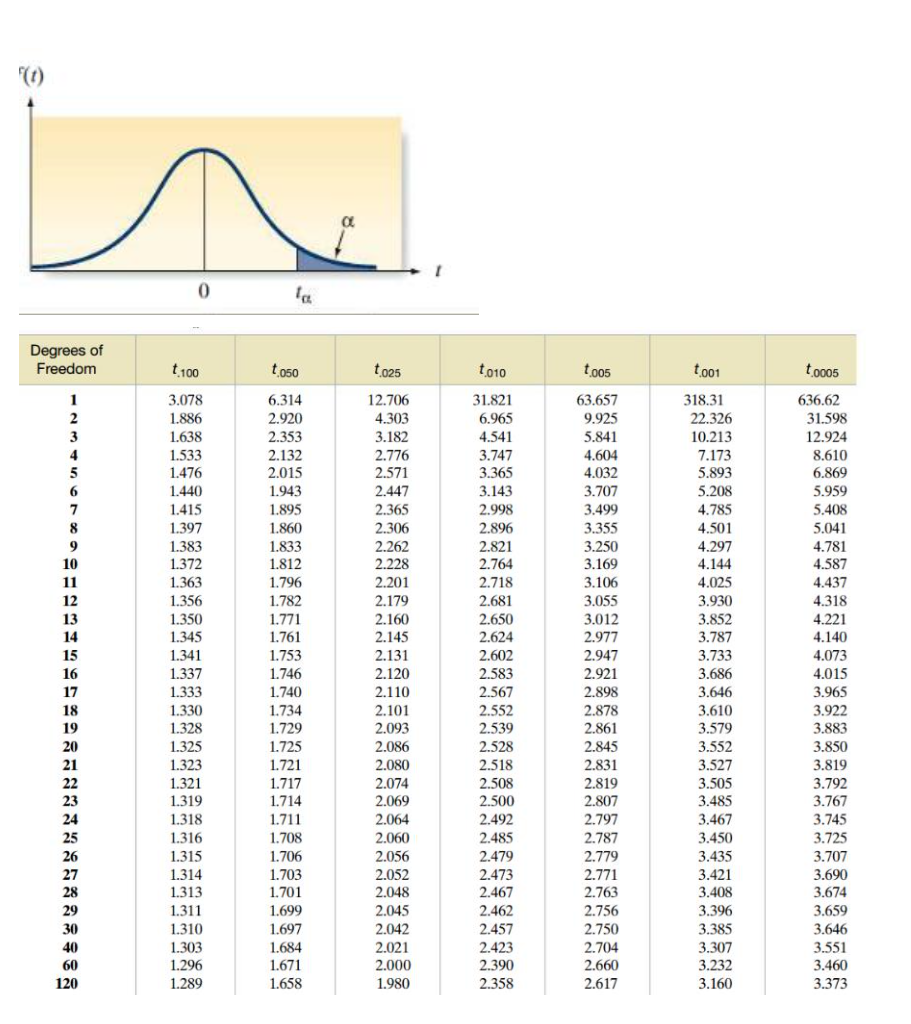
Feel free to use the Normal table and the table attached
Transcribed Image Text:"(1)
Degrees of
Freedom
t 100
t050
t025
to10
to05
to01
to005
3.078
1.886
1.638
6.314
12.706
31.821
63.657
318.31
636.62
4.303
3.182
6.965
4.541
22.326
31.598
12.924
8.610
6.869
5.959
2.920
9.925
3
2.353
5.841
10.213
1.533
1.476
2.132
2.776
3.747
4.604
7.173
3.365
3.143
5.893
5.208
2.015
2.571
4.032
3.707
1.440
1.943
2.447
1.415
1.895
2.365
2.998
3.499
4.785
5.408
8
1.397
1.860
2.306
2.896
3.355
4.501
5.041
1.383
1.372
1.363
2.262
2.228
2.821
2.764
4.781
4.587
9
1.833
3.250
4.297
3.169
3.106
10
1.812
4.144
11
1.796
2.201
2.718
4.025
4.437
12
1.356
1.782
2.179
2.681
3.055
3.012
2.977
3.930
3.852
3.787
3.733
4.318
13
1.350
1.771
2.160
2.650
4.221
1.761
1.753
1.746
14
1.345
2.145
2.624
4.140
2.602
2.583
2.567
15
1.341
1.337
2.131
2.947
4.073
2.120
2.110
4.015
3.965
16
2.921
3.686
1.333
1.330
3.646
3.610
3.579
3.552
17
1.740
2.898
18
1.734
2.101
2.552
2.878
3.922
19
1.328
1.729
2.093
2.539
2.861
3.883
20
1.325
1.725
2.086
2.528
3.850
2.845
2.831
1.323
1.321
1.319
1.318
21
1.721
2.080
2.518
3.527
3.819
2.508
2.500
22
3.505
3.485
3.467
1.717
2.074
2.819
3.792
3.767
3.745
23
1.714
2.069
2.807
24
1.711
2.064
2.492
2.797
1.316
1.315
25
1.708
2.060
2.485
2.787
3.450
3.725
3.707
26
1.706
2.056
2.479
2.779
3.435
2.473
2.467
2.462
1.314
1.703
2.052
2.771
3.421
3.408
3.690
28
1.313
1.701
2.048
2.763
3.674
1.311
1.310
3.659
3.646
29
1.699
2.045
2.756
2.750
3.396
30
1.697
2.042
2.457
3.385
40
1.303
1.684
2.021
2.423
2.704
3.307
3.551
3.460
60
1.296
1.671
2.000
2.390
2.660
3.232
120
1.289
1.658
1.980
2.358
2.617
3.160
3.373
Transcribed Image Text:Are student-athletes at Division I universities poorer students than non-athletes? The
National College Athlete Association (NCAA) measures the academic outcomes of
student-athletes with the Graduation Success Rate (GSR) – the percentage of eligible
athletes who graduate within six years of entering college. According to NCAA, the GSR
for all scholarship athletes at Division I institutions is 63%. It is well known that the GSR
for all students at Division I colleges is 60%. Suppose the NCAA report was based on a
sample of 500 student-athletes, of which 315 graduated within six years. Is this sufficient
information to conclude that the GSR for all scholarship athletes at Division I institutions
differs from 60%? Test using a =.05.
a. What is the parameter of interest?
b. State the hypotheses.
c. What test statistic will you use and why? Explain.
d. Calculate the value of the test statistic.
e. Rejection region:
f. Conclusion:
g. Construct a 95% confidence interval for the parameter of interest and interpret your
result.
Expert Solution
This question has been solved!
Explore an expertly crafted, step-by-step solution for a thorough understanding of key concepts.

This is a popular solution!

Trending now
This is a popular solution!

Step by step
Solved in 4 steps

Knowledge Booster


Learn more about
Need a deep-dive on the concept behind this application? Look no further. Learn more about this topic, statistics and related others by exploring similar questions and additional content below.Recommended textbooks for you
Glencoe Algebra 1, Student Edition, 9780079039897…
Algebra
ISBN:
9780079039897
Author:
Carter
Publisher:
McGraw Hill

Holt Mcdougal Larson Pre-algebra: Student Edition…
Algebra
ISBN:
9780547587776
Author:
HOLT MCDOUGAL
Publisher:
HOLT MCDOUGAL
Glencoe Algebra 1, Student Edition, 9780079039897…
Algebra
ISBN:
9780079039897
Author:
Carter
Publisher:
McGraw Hill
Holt Mcdougal Larson Pre-algebra: Student Edition…
Algebra
ISBN:
9780547587776
Author:
HOLT MCDOUGAL
Publisher:
HOLT MCDOUGAL