Aromatics Chloroalkanes Esters; 1.06 0.95 1.58 1.12 0.29 0.43 0.06 0.06 0.51 0.09 0.79 0.65 1.45 0.91 0.82 1.15 0.44 0.10 0.17 0.57 0.83 1.16 0.43 0.89 1.12 0.55 0.53 0.17 1.05 0.61 0.34 0.60 Is there a significant difference in the mean sorption rate for the three solvents at 0.05 level of significance ?
Aromatics Chloroalkanes Esters; 1.06 0.95 1.58 1.12 0.29 0.43 0.06 0.06 0.51 0.09 0.79 0.65 1.45 0.91 0.82 1.15 0.44 0.10 0.17 0.57 0.83 1.16 0.43 0.89 1.12 0.55 0.53 0.17 1.05 0.61 0.34 0.60 Is there a significant difference in the mean sorption rate for the three solvents at 0.05 level of significance ?

MATLAB: An Introduction with Applications
6th Edition
ISBN:9781119256830
Author:Amos Gilat
Publisher:Amos Gilat
Chapter1: Starting With Matlab
Section: Chapter Questions
Problem 1P

Related questions
Question
Please help
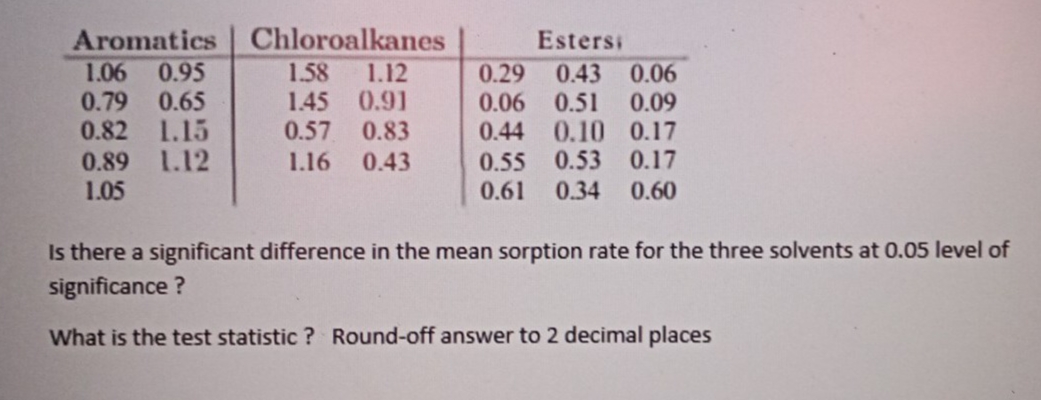
Transcribed Image Text:Aromatics
Chloroalkanes
Esters;
1.06 0.95
1.58
1.12
0.29 0.43 0.06
0.79 0.65
1.45 0.91
0.06 0.51 0.09
0.10 0.17
0.82 1.15
0.57 0.83
0.44
1.16 0.43
0.55 0.53 0.17
0.89 1.12
1.05
0.61 0.34 0.60
Is there a significant difference in the mean sorption rate for the three solvents at 0.05 level of
significance ?
What is the test statistic? Round-off answer to 2 decimal places
Expert Solution
This question has been solved!
Explore an expertly crafted, step-by-step solution for a thorough understanding of key concepts.

Step by step
Solved in 2 steps with 1 images

Recommended textbooks for you
MATLAB: An Introduction with Applications
Statistics
ISBN:
9781119256830
Author:
Amos Gilat
Publisher:
John Wiley & Sons Inc

Probability and Statistics for Engineering and th…
Statistics
ISBN:
9781305251809
Author:
Jay L. Devore
Publisher:
Cengage Learning

Statistics for The Behavioral Sciences (MindTap C…
Statistics
ISBN:
9781305504912
Author:
Frederick J Gravetter, Larry B. Wallnau
Publisher:
Cengage Learning
MATLAB: An Introduction with Applications
Statistics
ISBN:
9781119256830
Author:
Amos Gilat
Publisher:
John Wiley & Sons Inc
Probability and Statistics for Engineering and th…
Statistics
ISBN:
9781305251809
Author:
Jay L. Devore
Publisher:
Cengage Learning
Statistics for The Behavioral Sciences (MindTap C…
Statistics
ISBN:
9781305504912
Author:
Frederick J Gravetter, Larry B. Wallnau
Publisher:
Cengage Learning

Elementary Statistics: Picturing the World (7th E…
Statistics
ISBN:
9780134683416
Author:
Ron Larson, Betsy Farber
Publisher:
PEARSON

The Basic Practice of Statistics
Statistics
ISBN:
9781319042578
Author:
David S. Moore, William I. Notz, Michael A. Fligner
Publisher:
W. H. Freeman

Introduction to the Practice of Statistics
Statistics
ISBN:
9781319013387
Author:
David S. Moore, George P. McCabe, Bruce A. Craig
Publisher:
W. H. Freeman