ates, two color variants of the Eastern Gray Squirrel-gray and black-are found in the rrels in a large forest wonders if there is a difference in the sizes of the two-color variants. rels of each color from a large forest and weighs them. The 40 black squirrels have a ard deviation of 2.1 ounces. The 40 gray squirrels have a mean weight of 19.2 ounces squirrels and µ₂ = the true mean weight of gray squirrels. nce at the a = 0.01 significance level of a difference in the mean weights of all gray and est? nce that the true mean weight of black squirrels is different than the true mean weight (20.3-19.2)-0 = = 2.46. 2.12 1.92 40 40 O versus Ha ₁ - μ₂ = 0. than 0.01.
ates, two color variants of the Eastern Gray Squirrel-gray and black-are found in the rrels in a large forest wonders if there is a difference in the sizes of the two-color variants. rels of each color from a large forest and weighs them. The 40 black squirrels have a ard deviation of 2.1 ounces. The 40 gray squirrels have a mean weight of 19.2 ounces squirrels and µ₂ = the true mean weight of gray squirrels. nce at the a = 0.01 significance level of a difference in the mean weights of all gray and est? nce that the true mean weight of black squirrels is different than the true mean weight (20.3-19.2)-0 = = 2.46. 2.12 1.92 40 40 O versus Ha ₁ - μ₂ = 0. than 0.01.

MATLAB: An Introduction with Applications
6th Edition
ISBN:9781119256830
Author:Amos Gilat
Publisher:Amos Gilat
Chapter1: Starting With Matlab
Section: Chapter Questions
Problem 1P

Related questions
Question
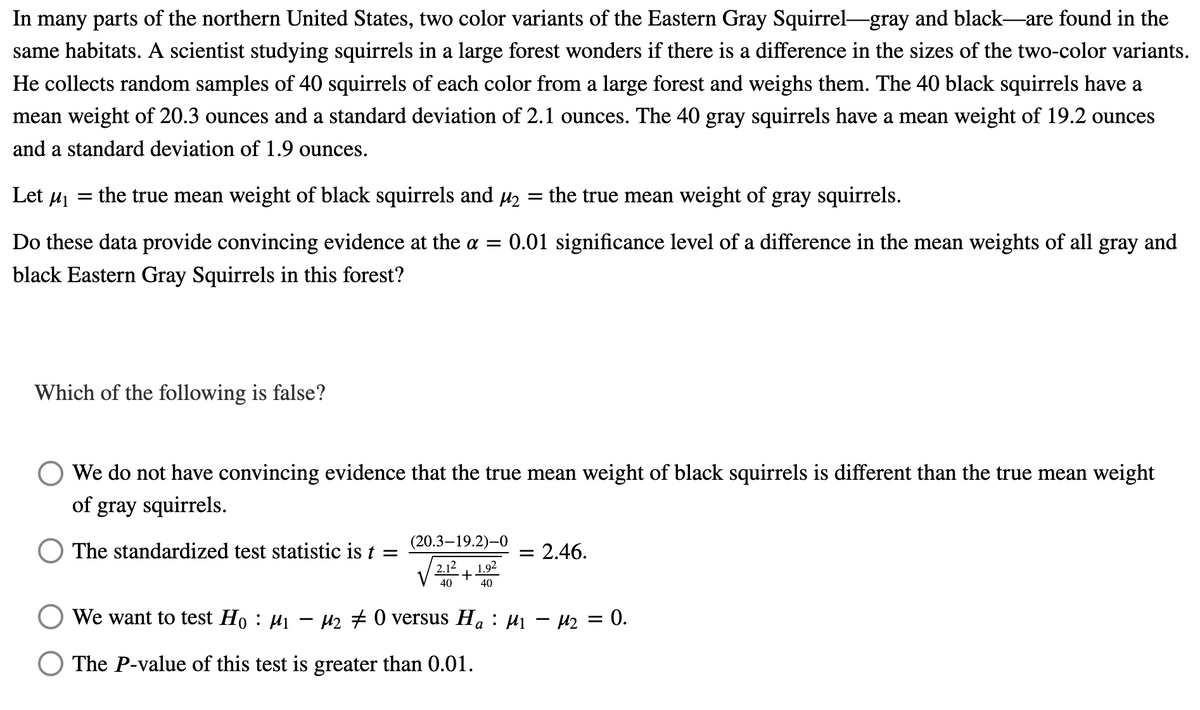
Transcribed Image Text:In many parts of the northern United States, two color variants of the Eastern Gray Squirrel-gray and black—are found in the
same habitats. A scientist studying squirrels in a large forest wonders if there is a difference in the sizes of the two-color variants.
He collects random samples of 40 squirrels of each color from a large forest and weighs them. The 40 black squirrels have a
mean weight of 20.3 ounces and a standard deviation of 2.1 ounces. The 40 gray squirrels have a mean weight of 19.2 ounces
and a standard deviation of 1.9 ounces.
Let M₁
=
the true mean weight of black squirrels and µ₂ = the true mean weight of gray squirrels.
Do these data provide convincing evidence at the a = = 0.01 significance level of a difference in the mean weights of all gray and
black Eastern Gray Squirrels in this forest?
Which of the following is false?
We do not have convincing evidence that the true mean weight of black squirrels is different than the true mean weight
of gray squirrels.
The standardized test statistic is t =
(20.3-19.2)-0
2.12 1.92
= 2.46.
40
+
40
We want to test H。 : µ₁ − µ₂ ‡ 0 versus H₁ : µ₁ − µ₂ = 0.
The P-value of this test is greater than 0.01.
Expert Solution
This question has been solved!
Explore an expertly crafted, step-by-step solution for a thorough understanding of key concepts.

This is a popular solution!

Trending now
This is a popular solution!

Step by step
Solved in 2 steps with 2 images

Recommended textbooks for you
MATLAB: An Introduction with Applications
Statistics
ISBN:
9781119256830
Author:
Amos Gilat
Publisher:
John Wiley & Sons Inc

Probability and Statistics for Engineering and th…
Statistics
ISBN:
9781305251809
Author:
Jay L. Devore
Publisher:
Cengage Learning

Statistics for The Behavioral Sciences (MindTap C…
Statistics
ISBN:
9781305504912
Author:
Frederick J Gravetter, Larry B. Wallnau
Publisher:
Cengage Learning
MATLAB: An Introduction with Applications
Statistics
ISBN:
9781119256830
Author:
Amos Gilat
Publisher:
John Wiley & Sons Inc
Probability and Statistics for Engineering and th…
Statistics
ISBN:
9781305251809
Author:
Jay L. Devore
Publisher:
Cengage Learning
Statistics for The Behavioral Sciences (MindTap C…
Statistics
ISBN:
9781305504912
Author:
Frederick J Gravetter, Larry B. Wallnau
Publisher:
Cengage Learning

Elementary Statistics: Picturing the World (7th E…
Statistics
ISBN:
9780134683416
Author:
Ron Larson, Betsy Farber
Publisher:
PEARSON

The Basic Practice of Statistics
Statistics
ISBN:
9781319042578
Author:
David S. Moore, William I. Notz, Michael A. Fligner
Publisher:
W. H. Freeman

Introduction to the Practice of Statistics
Statistics
ISBN:
9781319013387
Author:
David S. Moore, George P. McCabe, Bruce A. Craig
Publisher:
W. H. Freeman