Assume that adults have IQ scores that are normally distributed with a mean of μ = 100 and a standard deviation = 15. Find the probability that a randomly selected adult has an IQ less than 118. Click to view page 1 of the table. Click to view page 2 of the table. The probability that a randomly selected adult has an IQ less than 118 is (Type an integer or decimal rounded to four decimal places s needed.) Standard Normal Table (Page 2) POSITIVE Z Scores Standard Normal (2) Distribution: Cumulative Area from the LEFT - X Standard Normal Table (Page 1) NEGATIVE z Scores -3.50 Standard Normal (2) Distribution: Cumulative Area from the LEFT ,00 01 02 03 04 05 06 07 08
Assume that adults have IQ scores that are normally distributed with a mean of μ = 100 and a standard deviation = 15. Find the probability that a randomly selected adult has an IQ less than 118. Click to view page 1 of the table. Click to view page 2 of the table. The probability that a randomly selected adult has an IQ less than 118 is (Type an integer or decimal rounded to four decimal places s needed.) Standard Normal Table (Page 2) POSITIVE Z Scores Standard Normal (2) Distribution: Cumulative Area from the LEFT - X Standard Normal Table (Page 1) NEGATIVE z Scores -3.50 Standard Normal (2) Distribution: Cumulative Area from the LEFT ,00 01 02 03 04 05 06 07 08

MATLAB: An Introduction with Applications
6th Edition
ISBN:9781119256830
Author:Amos Gilat
Publisher:Amos Gilat
Chapter1: Starting With Matlab
Section: Chapter Questions
Problem 1P

Related questions
Question
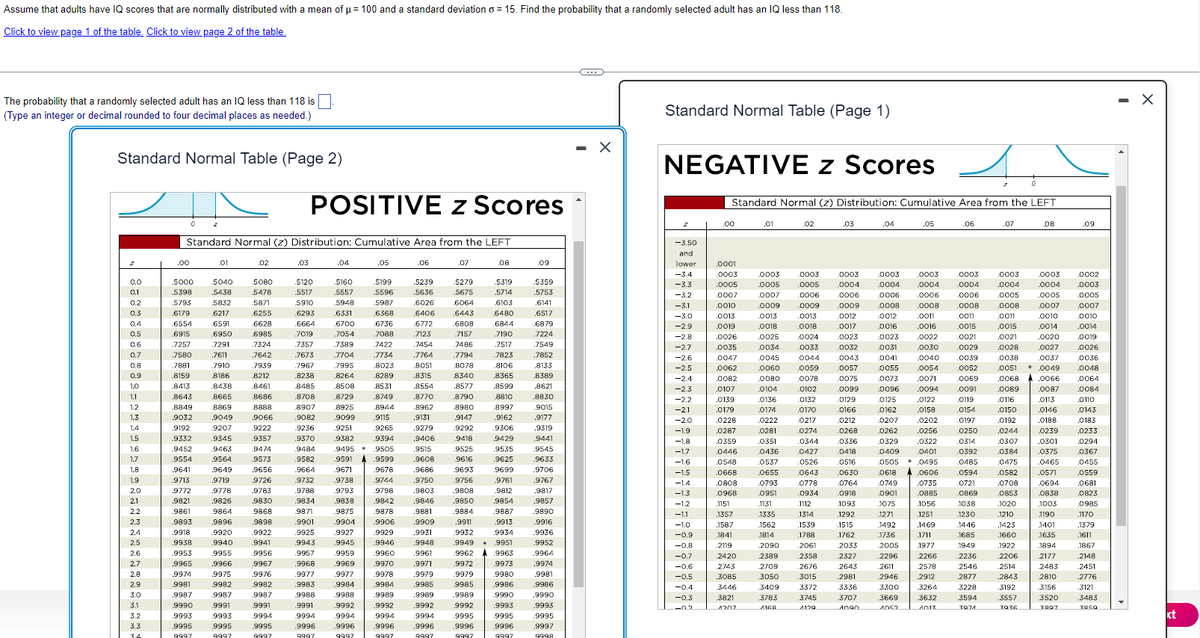
Transcribed Image Text:Assume that adults have IQ scores that are normally distributed with a mean of μ = 100 and a standard deviation o=15. Find the probability that a randomly selected adult has an IQ less than 118.
Click to view page 1 of the table. Click to view page 2 of the table.
The probability that a randomly selected adult has an IQ less than 118 is
(Type an integer or decimal rounded to four decimal places as needed.)
Standard Normal Table (Page 2)
0.0
0,1
0.2
0.3
0.4
0.5
0.6
0.7
0.8
0.9
1.0
1.1
1.2
1.3
1.4
1.5
1.6
1.7
1.8
1.9
2.0
2.1
2.2
2.3
2.4
2.5
2.6
2.7
2.8
2.9
3.0
3.1
3.2
3.3
34
0
.00
Standard Normal (z) Distribution: Cumulative Area from the LEFT
.5000
5398
5793
.6179
.6554
.6915
7257
7580
.7881
.8159
.8413
.8643
.8849
9032
.9192
.9332
9452
.9554
9641
9713
9772
.9821
.9861
9893
.9918
.9938
Z
.9953
.9965
.9974
9981
.9987
9990
.9993
9995
9997
.01
5040
.5438
5832
.6217
.6591
.6950
7291
.7611
7910
.8186
8438
8665
8869
9049
9207
9345
9463
9564
.9649
.9719
.9778
.9826
9864
.9896
9920
9940
.9955
.9966
9975
.9982
9987
.9991
.9993
9995
9997
.02
5080
5478
5871
6255
6628
.6985
7324
7642
7939
.8212
.8461
8686
8888
9066
9222
9357
9474
.9573
.9656
.9726
9783
9830
9868
.9898
9922
9941
9956
9967
.9976
9982
9987
.9991
9994
.9995
9997
POSITIVE z Scores
.03
5120
.5160
.5517
.5557
5910 .5948
.6293
.6331
.6664
7019
7357
7673
7967
8238
8485
8708
.8907
.9082
.9236
9370
9484
.9582
9871
9901
.9925
9943
.9957
.04
.9968
9977
.9983
9988
.9991
9994
9996
9997
.6700
.7054
7389
.7704
7995
.8264
.8508
.8531
.8729
.8749
.8925
.8944
.9099
.9115
.9251
.9265
.9382
.9394
9495 9505
.9591
.9599
9664 .9671
.9732
.9738
9788
.9793
9834
.9838
.9875
.9904
.9927
.9945
.05
.9959
.9969
.9977
.9984
.9988
.9992
.9994
.9996
9997
.5199
.5596
.5987
.6368
.6736
.7088
7422
.7734
.8023
.8289
.9678
.9744
.9798
.9842
9878
.9906
.9929
.9946
9960
.9970
9978
9984
.9989
.9992
.9994
.9996
9997
.06
.5239
.5636
.6026
.6406
.6772
7123
7454
.7764
.8051
.8315
8554
.8770
.8962
.9131
.9279
.9406
9515
.9608
.9686
9750
.9803
.9846
.9881
.9909
.9931
.9948
9961
.9971
.9979
9985
.9989
.9992
.9994
.9996
9997
.07
5279
.5675
6064
5319
5714
.6103
6480
6844
.7190
7517
.7823
.8106
.8365
.8599
8810
.8997
.9162
9306
.9429
.9535
.9625
.9699
9756
.9761
.9808
9812
.9850
.9854
.9884
.9887
.9911
9913
9932
9934
9949 . .9951
.6443
.6808
7157
.7486
7794
.8078
.8340
.8577
.8790
.8980
.9147
9292
9418
9525
9616
9693
9962
.9972
9979
9985
.9989
.08
9992
.9995
9996
9997
.9963
9973
9980
9986
.9990
.9993
9995
9996
9997
.09
.5359
.5753
6141
.6517
.6879
.7224
.7549
.7852
.8133
.8389
.8621
8830
9015
.9177
.9319
9441
9545
.9633
.9706
.9767
.9817
.9857
.9890
9916
.9936
.9952
9964
.9974
.9981
.9986
.9990
.9993
.9995
.9997
9998
C
X
Standard Normal Table (Page 1)
NEGATIVE z Scores
Z
-3.50
and
lower
-3.4
-3.3
-3.2
-3.1
-3.0
-2.9
-2.8
-2.7
-2.6
-2.5
-2.4
-2.3
-2.2
-2.1
-2.0
-1.9
-1.8
-1.7
-1.6
-1.5
-1.4
-1.3
-1.2
-1.1
-1.0
-0.9
-0.8
-0.7
-0.6
-0.5
4
Standard Normal (z) Distribution: Cumulative Area from the LEFT
-0.4
-0.3
.00
.0001
.0003
.0005
.0007
.0010
.0013
.0019
.0026
.0035
.0047
0062
.0082
0107
.0139
.0179
0228
.0287
0359
0446
0548
0668
0808
.0968
1151
1357
1587
1841
2119
.2420
2743
.3085
3446
3821
4207
.01
0351
0436
0537
0655
0793
.0951
1131
1335
1562
1814
2090
.02
.0003 .0003 .0003
.0005 .0005 .0004
0007 .0006 .0006
0009 .0009
0013 .0013
0018 0018
.0024
.0025
0034
0045
0033
0044
0060 .0059
0080 0078
0104 .0102
.0136
.0132
0174
0170
0222
0217
0281
0274
2389
2709
3050
3409
3783
4168
.0344
0427
0526
.0643
.03
0778
0934
1112
1314
1539
1788
2061
2358
2676
.3015
3372
3745
4129
0212
0268
0336
0418
0516
0630
0764
.0918
1093
1292
1515
1762
.0003
0004
.0005
0007
0010
.0014
0003 .0003 .0003 .0003
.0004 .0004 .0004 .0004
.0006 .0006 .0006 .0005
.0009 .0008
.0008 .0008 .0008
0012
0012 .0011
.0011
,0011
0017
.0016 .0016 .0015
.0015
.0023
0023
.0021
.0032
0031
.0029
0041 .0040 .0039
0055 .0054 .0052
.0073 .0071 .0069
.0091
.0020
.0022
.0030
.0021
.0028
0038
.0027
0037
.0051 * 0049
0043
.0057
.0075
.0099
.0129
.0068 A.0066
.0125
0162
0096 .0094
.0122
.0158
0119
.0154
0166
.0089
.0116
0150
0192
0244
.0307
0207
0262
0329
0409
0505
0618
.0202 .0197
0250
0314
0392
0485
.0749
0901
1075
0384
0475
.0582
.0708
0853
1020
1210
1423
1271
1660
1922
.2206
.2514
.2843
3192
.3557
zaz6
2033
2327
.04
2643
2981
3336
3707
4090
1492
.1736
.2005
2296
2611
2946
.05
3300
.3669
4052
.06
.0256
.0322
.0401
* .0495
.0606
.0735
.0885
1056
1251
1469
1711
.1977
.2266
2578
.2912
3264
3632
4013
.07
0594
0721
.0869
1038
1230
1446
1685
1949
2236
2546
2877
3228
3594
3074
.08
0087
0113
0146
.0188
0239
.0301
.0375
.0465
.0571
0694
0838
1003
1190
1401
1635
1894
2177
2483
2810
.3156
3520
2007
.09
0002
.0003
0005
0007
0010
.0014
.0019
.0026
0036
.0048
.0064
.0084
.0110
0143
.0183
.0233
0294
.0367
0455
.0559
.0681
0823
0985
1170
.1379
1611
1867
2148
2451
2776
3121
3483
7259
X
kt
Expert Solution
This question has been solved!
Explore an expertly crafted, step-by-step solution for a thorough understanding of key concepts.

Step by step
Solved in 2 steps with 1 images

Recommended textbooks for you
MATLAB: An Introduction with Applications
Statistics
ISBN:
9781119256830
Author:
Amos Gilat
Publisher:
John Wiley & Sons Inc

Probability and Statistics for Engineering and th…
Statistics
ISBN:
9781305251809
Author:
Jay L. Devore
Publisher:
Cengage Learning

Statistics for The Behavioral Sciences (MindTap C…
Statistics
ISBN:
9781305504912
Author:
Frederick J Gravetter, Larry B. Wallnau
Publisher:
Cengage Learning
MATLAB: An Introduction with Applications
Statistics
ISBN:
9781119256830
Author:
Amos Gilat
Publisher:
John Wiley & Sons Inc
Probability and Statistics for Engineering and th…
Statistics
ISBN:
9781305251809
Author:
Jay L. Devore
Publisher:
Cengage Learning
Statistics for The Behavioral Sciences (MindTap C…
Statistics
ISBN:
9781305504912
Author:
Frederick J Gravetter, Larry B. Wallnau
Publisher:
Cengage Learning

Elementary Statistics: Picturing the World (7th E…
Statistics
ISBN:
9780134683416
Author:
Ron Larson, Betsy Farber
Publisher:
PEARSON

The Basic Practice of Statistics
Statistics
ISBN:
9781319042578
Author:
David S. Moore, William I. Notz, Michael A. Fligner
Publisher:
W. H. Freeman

Introduction to the Practice of Statistics
Statistics
ISBN:
9781319013387
Author:
David S. Moore, George P. McCabe, Bruce A. Craig
Publisher:
W. H. Freeman