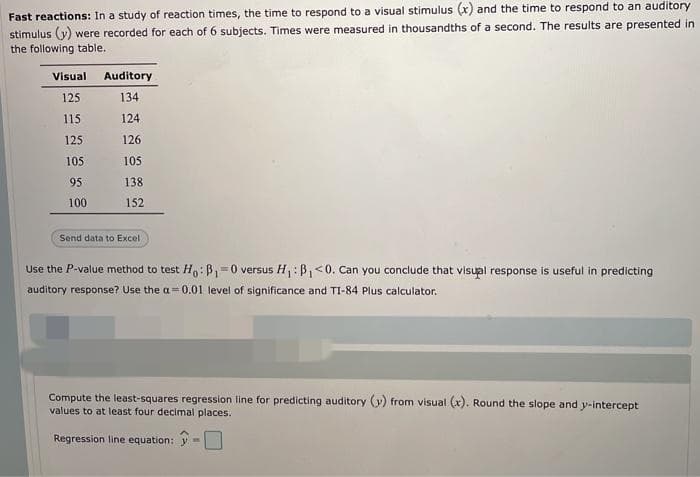
ast reactions: In a study of reaction times, the time to respond to a visual stimulus (x) and the time to respond to an auditory timulus (y) were recorded for each of 6 subjects. Times were measured in thousandths of a second. The results are presented in he following table. Visual Auditory 125 134 115 124 125 126 105 105 95 138 100 152 Send data to Excel Use the P-value method to test H:B,-0 versus H,: B,<0. Can you conclude that visual response is useful in predicting auditory response? Use the a=0.01 level of significance and TI-84 Plus calculator.


Inverse Normal Distribution
The method used for finding the corresponding z-critical value in a normal distribution using the known probability is said to be an inverse normal distribution. The inverse normal distribution is a continuous probability distribution with a family of two parameters.
Mean, Median, Mode
It is a descriptive summary of a data set. It can be defined by using some of the measures. The central tendencies do not provide information regarding individual data from the dataset. However, they give a summary of the data set. The central tendency or measure of central tendency is a central or typical value for a probability distribution.
Z-Scores
A z-score is a unit of measurement used in statistics to describe the position of a raw score in terms of its distance from the mean, measured with reference to standard deviation from the mean. Z-scores are useful in statistics because they allow comparison between two scores that belong to different normal distributions.


Trending now
This is a popular solution!

Step by step
Solved in 2 steps


