At ? = 0.10, can it be concluded that there is a difference in means of hours spent for studying between male and female based on point estimate in second attached image? Assume the population variances are unequal
At ? = 0.10, can it be concluded that there is a difference in means of hours spent for studying between male and female based on point estimate in second attached image? Assume the population variances are unequal

MATLAB: An Introduction with Applications
6th Edition
ISBN:9781119256830
Author:Amos Gilat
Publisher:Amos Gilat
Chapter1: Starting With Matlab
Section: Chapter Questions
Problem 1P

Related questions
Question
At ? = 0.10, can it be concluded that there is a difference in means of hours spent
for studying between male and female based on point estimate in second attached image?
Assume the population variances are unequal
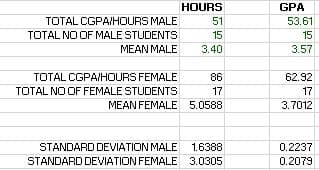
Transcribed Image Text:HOURS
GPA
TOTAL CGPAIHOURS MALE
51
53.61
TOTAL NO OF MALE STUDENTS
15
15
MEAN MALE
3.40
3.57
TOTAL CGPAIHOURS FEMALE
86
62.92
TOTAL NO OF FEMALE STUDENTS
17
17
MEAN FEMALE 5.0588
3.7012
STANDARD DEVIATION MALE 1.6388
0.2237
STANDARD DEVIATION FEMALE
3.0305
0.2079
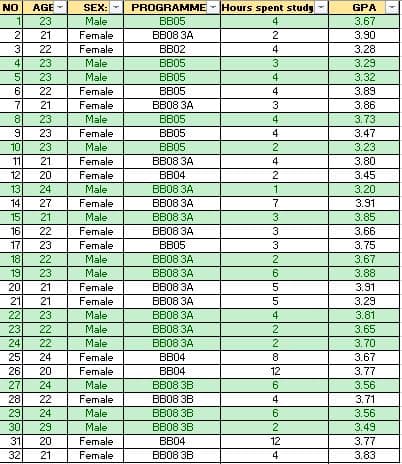
Transcribed Image Text:NO
AGE
SEX: -
PROGRAMME - Hours spent study
GPA
1
23
Male
BB05
4
3.67
21
Female
Вво8 ЗА
2
3.90
3
22
23
Female
BB02
4
3.28
4
Male
BB05
3
3.29
23
Male
BB05
4
3.32
6
22
Female
BB05
4
3.89
7
21
Female
Вв08 ЗА
3
3.86
23
Male
BB05
4
3.73
9
23
Female
BB05
4
3.47
10
23
Male
BB05
2
3.23
11
21
Female
Вво8 ЗА
4
3.80
12
20
Female
BB04
2
3.45
13
24
Male
BB08 3A
1
3.20
14
27
Female
Вво8 ЗА
3.91
15
21
Male
BB08 3A
3
3.85
16
22
Female
BB08 3A
3
3.66
17
23
Female
BB05
3
3.75
18
22
Male
BB08 3A
2
3.67
19
23
Male
BB08 3A
3.88
20
21
Female
ВВо8 ЗА
5
3.91
21
21
Female
BB08 3A
5
3.29
22
23
Male
BB08 3A
4
3.81
23
22
Male
Вво8 ЗА
2
3.65
24
22
Male
Вво8 ЗА
3.70
25
24
Female
ВВ04
8
3.67
26
20
Female
BB04
12
3.77
27
24
Male
BB08 3B
6
3.56
28
22
Female
BB08 3B
4
3.71
29
24
Male
BB08 3B
6.
3.56
30
29
Male
BB08 3B
2
3.49
31
20
Female
BB04
12
3.77
32
21
Female
BB08 3B
4
3.83
Expert Solution
This question has been solved!
Explore an expertly crafted, step-by-step solution for a thorough understanding of key concepts.

Step by step
Solved in 2 steps

Recommended textbooks for you
MATLAB: An Introduction with Applications
Statistics
ISBN:
9781119256830
Author:
Amos Gilat
Publisher:
John Wiley & Sons Inc

Probability and Statistics for Engineering and th…
Statistics
ISBN:
9781305251809
Author:
Jay L. Devore
Publisher:
Cengage Learning

Statistics for The Behavioral Sciences (MindTap C…
Statistics
ISBN:
9781305504912
Author:
Frederick J Gravetter, Larry B. Wallnau
Publisher:
Cengage Learning
MATLAB: An Introduction with Applications
Statistics
ISBN:
9781119256830
Author:
Amos Gilat
Publisher:
John Wiley & Sons Inc
Probability and Statistics for Engineering and th…
Statistics
ISBN:
9781305251809
Author:
Jay L. Devore
Publisher:
Cengage Learning
Statistics for The Behavioral Sciences (MindTap C…
Statistics
ISBN:
9781305504912
Author:
Frederick J Gravetter, Larry B. Wallnau
Publisher:
Cengage Learning

Elementary Statistics: Picturing the World (7th E…
Statistics
ISBN:
9780134683416
Author:
Ron Larson, Betsy Farber
Publisher:
PEARSON

The Basic Practice of Statistics
Statistics
ISBN:
9781319042578
Author:
David S. Moore, William I. Notz, Michael A. Fligner
Publisher:
W. H. Freeman

Introduction to the Practice of Statistics
Statistics
ISBN:
9781319013387
Author:
David S. Moore, George P. McCabe, Bruce A. Craig
Publisher:
W. H. Freeman