At the beginning of the COVID-19 Pandemic, the Department of Health used a graph to represent the prediction of the number of active cases, if no interventions were made. The vertical axis gives the num- ber of active cases and the horizontal axis shows the number of days since the start of the pandemic. Pennsylvania residents were asked to quarantine to flatten the curve of the graph that represented the number of active infections. Which of the following statements are true? Select all that apply. A B C Flattening the curve would represented a vertical compression of the graph of the data. Flattening the curve would be a horizontal stretch of the graph of the data. When reading statistics reported in reputable news sources, it is ben- eficial to understand data measurement vocabulary.
At the beginning of the COVID-19 Pandemic, the Department of Health used a graph to represent the prediction of the number of active cases, if no interventions were made. The vertical axis gives the num- ber of active cases and the horizontal axis shows the number of days since the start of the pandemic. Pennsylvania residents were asked to quarantine to flatten the curve of the graph that represented the number of active infections. Which of the following statements are true? Select all that apply. A B C Flattening the curve would represented a vertical compression of the graph of the data. Flattening the curve would be a horizontal stretch of the graph of the data. When reading statistics reported in reputable news sources, it is ben- eficial to understand data measurement vocabulary.

College Algebra (MindTap Course List)
12th Edition
ISBN:9781305652231
Author:R. David Gustafson, Jeff Hughes
Publisher:R. David Gustafson, Jeff Hughes
Chapter2: Functions And Graphs
Section2.3: Linear Functions And Slope
Problem 89E: Rage of decrease The price of computers has been dropping steadily for the past ten years. If a...

Related questions
Question
Transcribed Image Text:ariants/1017828/take/5/
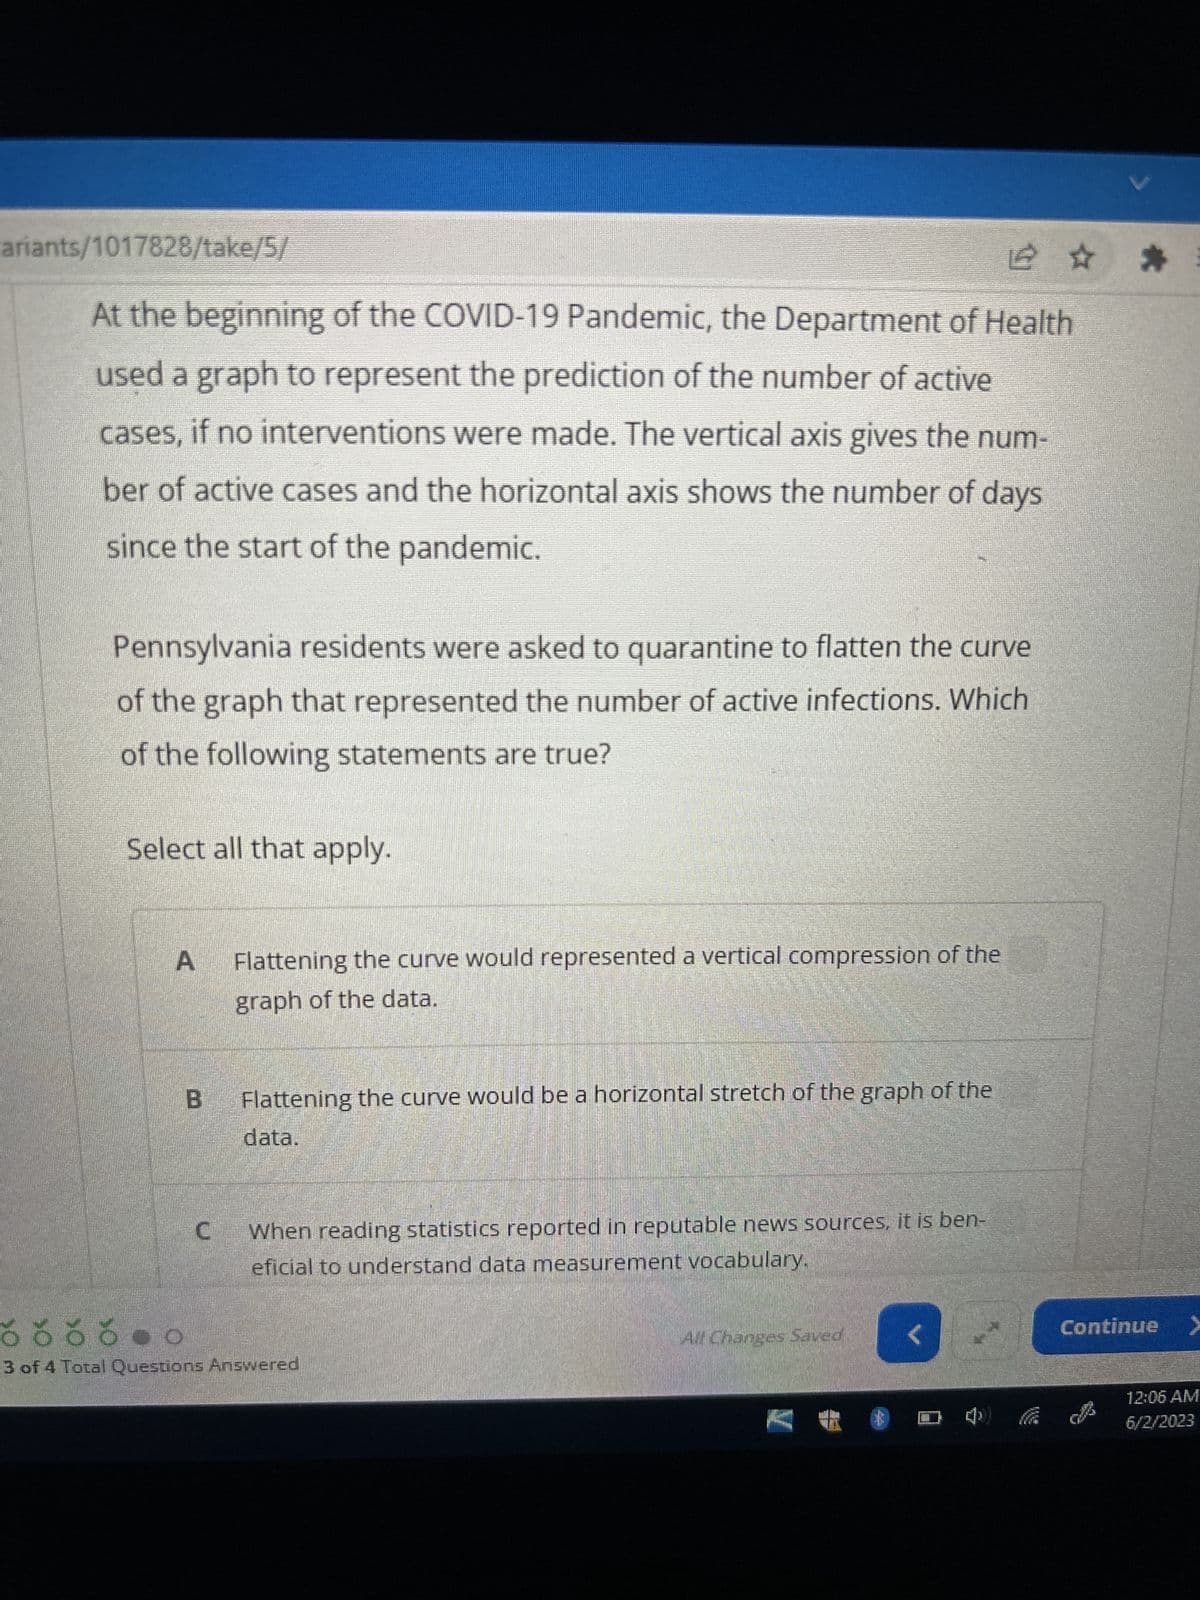
At the beginning of the COVID-19 Pandemic, the Department of Health
used a graph to represent the prediction of the number of active
cases, if no interventions were made. The vertical axis gives the num-
ber of active cases and the horizontal axis shows the number of days
since the start of the pandemic.
Pennsylvania residents were asked to quarantine to flatten the curve
of the graph that represented the number of active infections. Which
of the following statements are true?
Select all that apply.
A
B
Flattening the curve would represented a vertical compression of the
graph of the data.
Flattening the curve would be a horizontal stretch of the graph of the
data.
When reading statistics reported in reputable news sources, it is ben-
eficial to understand data measurement vocabulary.
6666
booo
3 of 4 Total Questions Answered
All Changes Saved
2 :
□ O
Continue >
12:06 AM
6/2/2023
Expert Solution
This question has been solved!
Explore an expertly crafted, step-by-step solution for a thorough understanding of key concepts.

This is a popular solution!

Trending now
This is a popular solution!

Step by step
Solved in 3 steps

Recommended textbooks for you
College Algebra (MindTap Course List)
Algebra
ISBN:
9781305652231
Author:
R. David Gustafson, Jeff Hughes
Publisher:
Cengage Learning

Algebra & Trigonometry with Analytic Geometry
Algebra
ISBN:
9781133382119
Author:
Swokowski
Publisher:
Cengage
College Algebra (MindTap Course List)
Algebra
ISBN:
9781305652231
Author:
R. David Gustafson, Jeff Hughes
Publisher:
Cengage Learning
Algebra & Trigonometry with Analytic Geometry
Algebra
ISBN:
9781133382119
Author:
Swokowski
Publisher:
Cengage