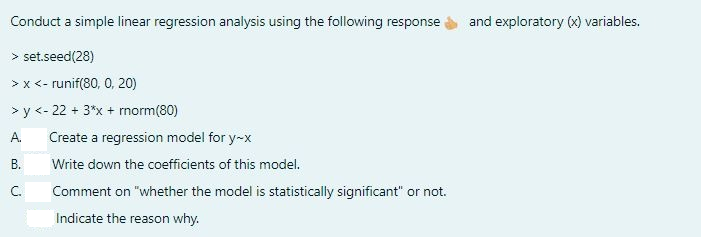
Conduct a simple linear regression analysis using the following response > set.seed (28) >x<-runif(80, 0, 20) >y<-22 + 3*x + rnorm(80) and exploratory (x) variables.


Q: Find the margin of error for the given values of c, s, and n.
A: Given that, c=0.95α=1-C=1-0.95=0.05s=3.3n=16 To find the margin of error (E).
Q: Using the data from the graph below and the fact that the average seasonal factor for quarter 1 is…
A: The additive decomposition model of the forecasting is given as: Yt=Tt+St+Et, where, Tt=Trend…
Q: Following are age and price data for 8 randomly selected ambulances between 1 and 6 years old. Here,…
A: X : { 6,1,6,2,6,2,4,5 } Y : { 260,420,255,370,280,350,315,300 } N=8 ΣX = 32 ΣY = 2550 ΣXY = 9390…
Q: Ch: Estimating Random Variables Q: The minimum of two independent exponential random variables with…
A: In this problem, it is given that there are 2 independent exponential random variables with a mean…
Q: Q28 If A is 3 occurrences per five-minute time interval, find the probability of getting occurrences…
A: Note:- "Since you have posted multiple questions, we will provide the solution only to the first…
Q: Three popular fast-food restaurant franchises specializing in burgers were surveyed to find out the…
A: Restaurant 1 Restaurant 2 Restaurant 3 970 1010 740 880 970 540 840 920 510 710 850 510…
Q: The following data represent the concentration of dissolved organic carbon (mg/L) collected from 20…
A: Given that: n= 20 Sample size
Q: Test the independence of the two variables in the table below: Enter the test statistic (to 4…
A: The required formula is, Where, Oi is the observed frequency and Ei is the expected frequency.
Q: A study was done to look at the relationship between number of vacation days employees take each…
A: As per the Bartleby guidelines, only three subparts can be answered. Kindly, resubmit with note for…
Q: A grocery store manager did a study to look at the relationship between the amount of time (in…
A: Given data is as follows: Time,x Money,y 12 24 7 13 13 58 17 41 9 38…
Q: METHODS AND APPLICATIONS Sound City sells the ClearTone-400 satellite car radio. For this radio,…
A: Given that, from the given information Radio(x) week P(x) 0 2…
Q: Find the margin of error for the 95% confidence interval used to estimate the population proportion.…
A: Confidence level = 95% Sample size (n) = 2440 Sample proportion (p̂) = 0.70
Q: The following are the age (in years) and price (in hundreds of dollars) data for a certain type of…
A: a. Define the variable age as x and the variable price as y.
Q: In a study of cell phone usage and brain hemispheric dominance, an Internet survey was e-mailed to…
A: It is given that- Total number of surveyed persons: n=6980 Number of surveys returned : x=1306 Level…
Q: The number of births per woman in China is 1.6 down from 5.91 in 1966. This fertility rate has been…
A: # of births Frequency 0 5 1 30 2 10
Q: In each of the following situations, indicate whether Walters, CPA is using unrestricted random…
A: We need to determine if the given questions were chosen using UR, SR, H, or B.
Q: The table below summarizes data from a survey of a sample of women. Using a 0.05 significance level,…
A: It is needed to check the claim that whether the proportions of agree/disagree responses are the…
Q: Which of the following statements regarding standard deviation is FALSE? Standard deviation is the…
A: Which of the following statements regarding standard deviation is FALSE? Standard deviation is the…
Q: An experiment is designed to measure the time necessary for a robotic lens to adapt to re ght. We…
A: Sample size n=50 Sample mean x¯=6.32 Sample standard deviation s=1.65
Q: For a linear regression problem, The actual observed y-value when x = 2 is y = 6. The least squares…
A: The actual observed y-value when x = 2 is y = 6. The least squares line is y=2x+1. The predicted…
Q: 6.4. Consider the Markov chain which at each transition either goes up 1 with probability p or down…
A: The problem deals with a Markov chain where, at each transition, there are two possible outcomes:…
Q: What is the Standard Error for the Confidence Interval? Use three decimal places and use the proper…
A: The sample size for age 18 to 44 is 515 of which 87 said yes. The sample size for age 45 to 64 is…
Q: the problem stated 66 independent students not 60
A: We need to correct the solution since mistakenly 60 is used in calculation when 66 should be used.
Q: Answer the following questions. You may use R on your own computer. 1) [ State the assumption of…
A: In the given model, the dependent variable is average credit card balance which is studied using an…
Q: The number of successes and the sample size for a simple random sample from a population are given…
A: The given information is x=7,n=28,H0:p=0.4,Ha:p<0.4,α=0.10.
Q: Find the margin of error for the 95% confidence interval used to estimate the population proportion.…
A: Given that n= 2440p^=70%=0.7 The confidence level is 95% confidence level.Significance…
Q: Indicate the level of measurement for the data set described. Weights of newborn babies a. interval…
A: We need to indicate the scale of measurement used for the weight of newborn babies.
Q: (Simplify your answers.) Class Frequency Midpoint Relative Frequency Cumulative Frequency
A: The given data is 11 19 13 12 9 10 6 1 0 11 13 15 8 10 10 16 7 7 2 9
Q: A regression model (not necessarily linear) has been fit between an explanatory variable and a…
A: SSres=201.4 SSTt=1132.6
Q: The following results come from two independent random samples taken of two populations. Sample 1 n₁…
A: n1=40, x¯1=13.2, σ1=2.4n2=35, x¯2=11.4, σ2=3.3
Q: 3. The weekly demand for propane gas (in 1000s of gallons) from a particular facility is a random…
A: “Since you have asked multiple questions, we will solve the first question for you. If you want any…
Q: I need help solving the problems and instructions on how to solve it on TI84 calculator. Thank you.…
A: The question is about hypo. testing Given : Total no. of voters in a study ( n ) = 69 No. of voters…
Q: The mean weight baggage carried into an airplane by individual passengers at Clark International…
A: From the provided information, Sample size (n) = 1110 Sample mean (x̄) = 18.5 Sample standard…
Q: The data below shows the scores a sample of husbands and their wives received when given a happiness…
A: Consider the preliminary calculations given below:
Q: In order to control costs, a company wishes to study the amount of money its sales force spends…
A: (a) Use EXCEL Procedure for finding the values of mean and the variance. Follow the instruction to…
Q: In a random sample of four mobile devices, the mean repair cost was $85.00 and the standard…
A: It is given that sample mean is 85 and the standard deviation is 13.
Q: no prefer this particula next whole number. brand of pain killer is 2 percen
A: The given data is n = 400x = 8599% ci for pE = 0.02n = ?
Q: In a lottery game, a player picks six numbers from 1 to 24. If the player matches all six numbers,…
A: Suppose a variable x defines the net amount gained from the game. The player picks six number from 1…
Q: A sales manager for a large department store believes that customer spending per visit with a sale…
A: A sales manager for a large department store believes that customer spending per visit with a sale…
Q: Find 24th percentile, P24, from the following data 130 140 160 190 200 210 230 300 310 410 440 450…
A: Answer:- Given the following data 130, 140, 160, 190, 200, 210, 230, 300, 310, 410,…
Q: How do you know when to use each type of Chi-square test (Goodness-of-fit, Homogeneity, and…
A: We have to find which type of chi square test used in (Goodness of fit, Homogeneity,…
Q: Large samples of women and men are obtained, and the hemoglobin level is measured in each subject.…
A: The question is about confidence interval Given : CI : -1.76 < μ1 - μ2 < -1.62 Popl. 1 :…
Q: Use pooled estimator of p. a. What is the p-value (to 4 decimals)? Use Table 1 from Appendix B.…
A: Let p1 and p2 be the two population proportions. Given that, n1=100p¯1=0.24n2=300p¯2=0.13Level of…
Q: A survey of 50 young professionals found that they spent an average of $18.67 when dining out with a…
A: Sample size=50 Sample mean =$18.67 Sample standard deviation =12.06 We have to find the 95%…
Q: Four basketball teams took a random sample of players regarding how high each player can jump (in…
A: n=15 K=5
Q: A study was done to look at the relationship between number of vacation days employees take each…
A: The data is given as- x: vacation days y: sick days 3 4 13 0 1 10 6 1 12 0 1 6 13 0…
Q: Different patients are randomly selected and measured for pulse rate and body temperature. Using…
A: a. The independent variable is the pulse rates (x) and the dependent variable is the body…
Q: 3. Birmingham claimed that the Commonwealth Games which highlighted the region has improved the…
A: Let p1 denote the proportion of people amongst the residents of Birmingham, who thought that…
Q: A set of data has a normal distribution with a mean of 5.1 and a standard deviation of 0.9. Find the…
A: Give that a set of data has a normal distribution with a mean of 5.1 a d a standard deviation of…
Q: ^ For a linear regression problem, the least squares line is y = 2x+2. Determine the predicted value…
A: Y=2x+2 x=5

Step by step
Solved in 5 steps with 3 images

- The following fictitious table shows kryptonite price, in dollar per gram, t years after 2006. t= Years since 2006 0 1 2 3 4 5 6 7 8 9 10 K= Price 56 51 50 55 58 52 45 43 44 48 51 Make a quartic model of these data. Round the regression parameters to two decimal places.Olympic Pole Vault The graph in Figure 7 indicates that in recent years the winning Olympic men’s pole vault height has fallen below the value predicted by the regression line in Example 2. This might have occurred because when the pole vault was a new event there was much room for improvement in vaulters’ performances, whereas now even the best training can produce only incremental advances. Let’s see whether concentrating on more recent results gives a better predictor of future records. (a) Use the data in Table 2 (page 176) to complete the table of winning pole vault heights shown in the margin. (Note that we are using x=0 to correspond to the year 1972, where this restricted data set begins.) (b) Find the regression line for the data in part ‚(a). (c) Plot the data and the regression line on the same axes. Does the regression line seem to provide a good model for the data? (d) What does the regression line predict as the winning pole vault height for the 2012 Olympics? Compare this predicted value to the actual 2012 winning height of 5.97 m, as described on page 177. Has this new regression line provided a better prediction than the line in Example 2?In a multiple regression analysis with three independent variables (X1, X2, and X3), what is the general form of the regression equation used to model the relationship between the dependent variable (Y) and the independent variables (X1, X2, and X3)?
- A study is conducted to determine if there is a relationship between the two variables, blood haemoglobin (Hb) levels and packed cell volumes (PCV) in the female population. A simple linear regression analysis was performed, and SPSS output of the coefficient table was obtained. Which of the following regression models is correctly presented? A. Y = 0.877 -5.19X B. Y = 45.86 -5.19X C. Y = -1.71 + 6.32X D. Y = -5.19 + 45.86XAccording to the summary result of linear regression model between A and B obtained from R given below, we can fit a regression line. Assume thatA has any value. If we decrease the value of A by 3, how would Y be affected?a) 58.8945 decreaseb) 58.8945 increasec) 29.8827 increased) 49.5142 decreasee) 29.8827 decreaseNaturalSciences Engineering SocialSciences Education 1990 70 10 60 30 1995 130 40 110 50 2000 330 130 280 120 2005 490 370 460 210 2010 590 550 830 520 2012 690 590 1,000 900 (a) With x = the number of social science doctorates and y = the number of education doctorates, use technology to obtain the regression equation. (Round coefficients to three significant digits.) y(x) =
- We wish to predict the salary for baseball players (y) using the variables RBI (x1) and HR (x2), then we use a regression equation of the form ˆy=b0+b1x1+b2x2y^=b0+b1x1+b2x2. HR - Home runs - hits on which the batter successfully touched all four bases, without the contribution of a fielding error. RBI - Run batted in - number of runners who scored due to a batters's action, except when batter grounded into double play or reached on an error Salary is in millions of dollars. The following is a chart of baseball players' salaries and statistics from 2016. Player Name RBI's HR's Salary (in millions) Adrian Beltre 104 32 18.000 Justin Smoak 34 14 3.900 Jean Segura 64 20 2.600 Justin Upton 87 31 22.125 Brandon Crawford 84 12 6.000 Curtis Granderson 59 30 16.000 Aaron Hill 38 10 12.000 Miquel Cabrera 108 38 28.050 Adrian Gonzalez 90 18 21.857 Jacoby Ellsbury 56 9 21.143 Mark Teixeira 44 15 23.125 Albert Pujols 119 31 25.000 Matt Wieters 66 17 15.800 Logan…The grades of a sample of 9 students on a prelim exam (x) and on the midterm exam (y) are shown below. Find the regression equation. y = 34.661 + 0.433x y = 0.777 + 12.0623x y = 12.0623 + 0.777x y = 34.661 - 0.433xA box office analyst seeks to predict opening weekend box office gross for movies. Toward this goal, the analyst plans to use online trailer views as a predictor. For each of the 66movies, the number of online trailer views from the release of the trailer through the Saturday before a movie opens and the opening weekend box office gross (in millions of dollars) are collected and stored in the accompanying table. A linear regression was performed on these data, and the result is the linear regression equation Yi=−0.372+1.3802Xi. Complete parts (a) through (d). a. Determine the coefficient of determination, r2, and interpret its meaning.b. Determine the standard error of the estimate.c. How useful do you think this regression model is for predicting opening weekend box office gross?d. Can you think of other variables that might explain the variation in opening weekend box office gross?

