Use the sample data and confidence level given below to complete parts (a) through (d). In a study of cell phone use and brain hemispheric dominance, an Internet survey was e-mailed to 2516 subjects randomly selected from an online group involved with ears. 1111 surveys were returned. Construct a 90% confidence interval for the proportion of returned surveys. Click the icon to view a table of z scores. www a) Find the best point estimate of the population proportion p. (Round to three decimal places as needed.) b) Identify the value of the margin of error E. lete E (Round to three decimal places as needed.) c) Construct the confidence interval. <<
Use the sample data and confidence level given below to complete parts (a) through (d). In a study of cell phone use and brain hemispheric dominance, an Internet survey was e-mailed to 2516 subjects randomly selected from an online group involved with ears. 1111 surveys were returned. Construct a 90% confidence interval for the proportion of returned surveys. Click the icon to view a table of z scores. www a) Find the best point estimate of the population proportion p. (Round to three decimal places as needed.) b) Identify the value of the margin of error E. lete E (Round to three decimal places as needed.) c) Construct the confidence interval. <<

College Algebra (MindTap Course List)
12th Edition
ISBN:9781305652231
Author:R. David Gustafson, Jeff Hughes
Publisher:R. David Gustafson, Jeff Hughes
Chapter8: Sequences, Series, And Probability
Section8.7: Probability
Problem 8E: List the sample space of each experiment. Picking a one-digit number

Related questions
Question
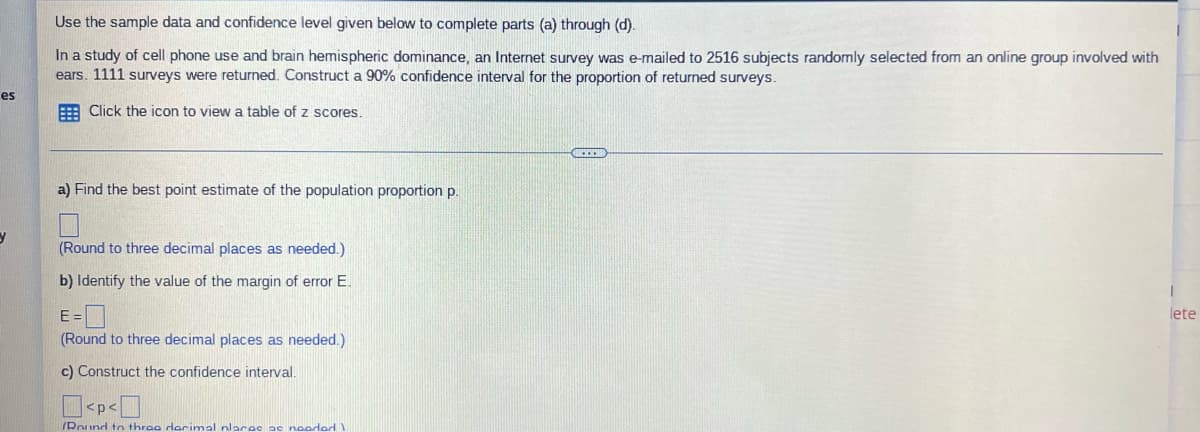
Transcribed Image Text:Use the sample data and confidence level given below to complete parts (a) through (d).
In a study of cell phone use and brain hemispheric dominance, an Internet survey was e-mailed to 2516 subjects randomly selected from an online group involved with
ears. 1111 surveys were returned. Construct a 90% confidence interval for the proportion of returned surveys.
es
Click the icon to view a table of z scores.
a) Find the best point estimate of the population proportion p.
(Round to three decimal places as needed.)
b) Identify the value of the margin of error E.
I
lete
E=
(Round to three decimal places as needed.)
c) Construct the confidence interval.
/Round to three decimal nlarae ac noodlod 1
y
<p<
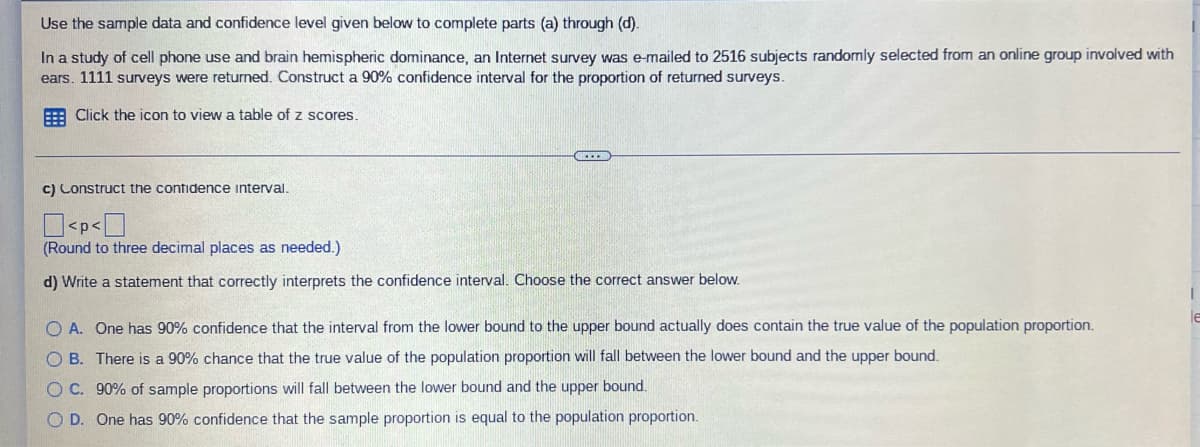
Transcribed Image Text:Use the sample data and confidence level given below to complete parts (a) through (d).
In a study of cell phone use and brain hemispheric dominance, an Internet survey was e-mailed to 2516 subjects randomly selected from an online group involved with
ears. 1111 surveys were returned. Construct a 90% confidence interval for the proportion of returned surveys.
Click the icon to view a table of z scores.
c) Construct the confidence interval.
<p<0
(Round to three decimal places as needed.)
d) Write a statement that correctly interprets the confidence interval. Choose the correct answer below.
O A. One has 90% confidence that the interval from the lower bound to the upper bound actually does contain the true value of the population proportion.
OB. There is a 90% chance that the true value of the population proportion will fall between the lower bound and the upper bound.
O C. 90% of sample proportions will fall between the lower bound and the upper bound.
OD. One has 90% confidence that the sample proportion is equal to the population proportion.
Expert Solution
This question has been solved!
Explore an expertly crafted, step-by-step solution for a thorough understanding of key concepts.

Step by step
Solved in 3 steps

Recommended textbooks for you
College Algebra (MindTap Course List)
Algebra
ISBN:
9781305652231
Author:
R. David Gustafson, Jeff Hughes
Publisher:
Cengage Learning

Glencoe Algebra 1, Student Edition, 9780079039897…
Algebra
ISBN:
9780079039897
Author:
Carter
Publisher:
McGraw Hill
College Algebra (MindTap Course List)
Algebra
ISBN:
9781305652231
Author:
R. David Gustafson, Jeff Hughes
Publisher:
Cengage Learning
Glencoe Algebra 1, Student Edition, 9780079039897…
Algebra
ISBN:
9780079039897
Author:
Carter
Publisher:
McGraw Hill