(b) To assess balance, you run a series of bivariate regression models with all X variables as dependent variables and treatment assignment as independent variable: X₁ Yo+Y₁Treatment Group,+E The following table shows y, i.e., the difference in all independent variables between treated and control groups. The p-values are shown in parentheses. ReadNews PoliticalInterest Education Female Income -0.018 (0.32) 0.086 (0.14) 0.207 (0.62) 0.007 (0.00) 0.113 (0.41) Does the treatment assigned group seem to differ from the control group for any of the independent variables? Use 0.05 as the p-value for 5% level of significance. Was the randomization successful?
(b) To assess balance, you run a series of bivariate regression models with all X variables as dependent variables and treatment assignment as independent variable: X₁ Yo+Y₁Treatment Group,+E The following table shows y, i.e., the difference in all independent variables between treated and control groups. The p-values are shown in parentheses. ReadNews PoliticalInterest Education Female Income -0.018 (0.32) 0.086 (0.14) 0.207 (0.62) 0.007 (0.00) 0.113 (0.41) Does the treatment assigned group seem to differ from the control group for any of the independent variables? Use 0.05 as the p-value for 5% level of significance. Was the randomization successful?

Functions and Change: A Modeling Approach to College Algebra (MindTap Course List)
6th Edition
ISBN:9781337111348
Author:Bruce Crauder, Benny Evans, Alan Noell
Publisher:Bruce Crauder, Benny Evans, Alan Noell
Chapter5: A Survey Of Other Common Functions
Section5.6: Higher-degree Polynomials And Rational Functions
Problem 1TU: The following fictitious table shows kryptonite price, in dollar per gram, t years after 2006. t=...

Related questions
Question
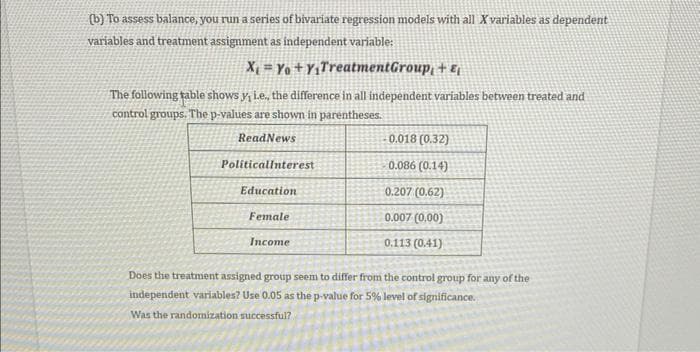
Transcribed Image Text:(b) To assess balance, you run a series of bivariate regression models with all X variables as dependent
variables and treatment assignment as independent variable:
X₁ Yo+Y₁TreatmentGroup, + &¡
The following table shows y, i.e., the difference in all independent variables between treated and
control groups. The p-values are shown in parentheses.
ReadNews
PoliticalInterest
Education
Female
Income
-0.018 (0.32)
0.086 (0.14)
0.207 (0.62)
0.007 (0.00)
0.113 (0.41)
Does the treatment assigned group seem to differ from the control group for any of the
independent variables? Use 0.05 as the p-value for 5% level of significance.
Was the randomization successful?
Expert Solution
This question has been solved!
Explore an expertly crafted, step-by-step solution for a thorough understanding of key concepts.

Step by step
Solved in 2 steps

Recommended textbooks for you
Functions and Change: A Modeling Approach to Coll…
Algebra
ISBN:
9781337111348
Author:
Bruce Crauder, Benny Evans, Alan Noell
Publisher:
Cengage Learning

Glencoe Algebra 1, Student Edition, 9780079039897…
Algebra
ISBN:
9780079039897
Author:
Carter
Publisher:
McGraw Hill
Functions and Change: A Modeling Approach to Coll…
Algebra
ISBN:
9781337111348
Author:
Bruce Crauder, Benny Evans, Alan Noell
Publisher:
Cengage Learning
Glencoe Algebra 1, Student Edition, 9780079039897…
Algebra
ISBN:
9780079039897
Author:
Carter
Publisher:
McGraw Hill