(b) Perform a Z-test and find the p-value. Here is some information to help you with your Z-test. x-μ • The value of the test statistic is given by √n • The p-value is two times the area under the curve to the left of the value of the test statistic. Standard Normal Distribution 04 Step 1: Select one-tailed or two-tailed. O One-tailed O Two-tailed 03- Step 2: Enter the test statistic. (Round to 3 decimal places.) 02+ Step 3: Shade the area represented by the p-value. 01+ Step 4: Enter the p-value. (Round to 3 decimal places.) (c) Based on your answer to part (b), choose what can be concluded, at the 0.05 level of significance, about the claim made by the company. O Since the p-value is less than (or equal to) the level of significance, the null hypothesis is rejected. So, there is enough evidence to reject the claim that the mean lifetime of the newest model of battery is 15 years. X O Since the p-value is less than (or equal to) the level of significance, the null hypothesis is not rejected. So, there is not enough evidence to reject the claim that the mean lifetime of the newest model of battery is 15 years. O Since the p-value is greater than the level of significance, the null hypothesis is rejected. So, there is enough evidence to reject the claim that the mean lifetime of the newest model of battery is 15 years. O Since the p-value is greater than the level of significance, the null hypothesis is not rejected. So, there is not enough evidence to reject the claim that the mean lifetime of the newest model of battery is 15 years.
(b) Perform a Z-test and find the p-value. Here is some information to help you with your Z-test. x-μ • The value of the test statistic is given by √n • The p-value is two times the area under the curve to the left of the value of the test statistic. Standard Normal Distribution 04 Step 1: Select one-tailed or two-tailed. O One-tailed O Two-tailed 03- Step 2: Enter the test statistic. (Round to 3 decimal places.) 02+ Step 3: Shade the area represented by the p-value. 01+ Step 4: Enter the p-value. (Round to 3 decimal places.) (c) Based on your answer to part (b), choose what can be concluded, at the 0.05 level of significance, about the claim made by the company. O Since the p-value is less than (or equal to) the level of significance, the null hypothesis is rejected. So, there is enough evidence to reject the claim that the mean lifetime of the newest model of battery is 15 years. X O Since the p-value is less than (or equal to) the level of significance, the null hypothesis is not rejected. So, there is not enough evidence to reject the claim that the mean lifetime of the newest model of battery is 15 years. O Since the p-value is greater than the level of significance, the null hypothesis is rejected. So, there is enough evidence to reject the claim that the mean lifetime of the newest model of battery is 15 years. O Since the p-value is greater than the level of significance, the null hypothesis is not rejected. So, there is not enough evidence to reject the claim that the mean lifetime of the newest model of battery is 15 years.

MATLAB: An Introduction with Applications
6th Edition
ISBN:9781119256830
Author:Amos Gilat
Publisher:Amos Gilat
Chapter1: Starting With Matlab
Section: Chapter Questions
Problem 1P

Related questions
Question
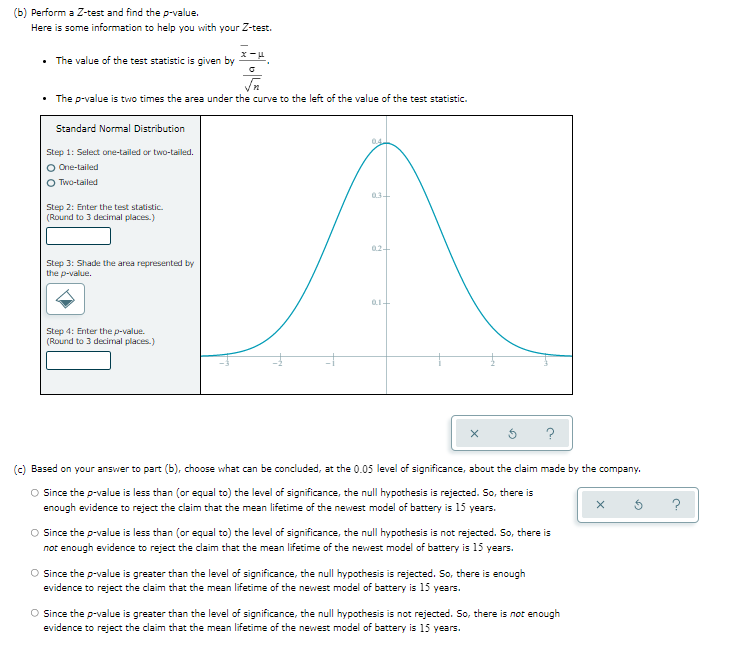
Transcribed Image Text:(b) Perform a Z-test and find the p-value.
Here is some information to help you with your Z-test.
x-μ
• The value of the test statistic is given by
√n
• The p-value is two times the area under the curve to the left of the value of the test statistic.
Standard Normal Distribution
04
Step 1: Select one-tailed or two-tailed.
O One-tailed
O Two-tailed
03-
Step 2: Enter the test statistic.
(Round to 3 decimal places.)
02+
Step 3: Shade the area represented by
the p-value.
01+
Step 4: Enter the p-value.
(Round to 3 decimal places.)
(c) Based on your answer to part (b), choose what can be concluded, at the 0.05 level of significance, about the claim made by the company.
O Since the p-value is less than (or equal to) the level of significance, the null hypothesis is rejected. So, there is
enough evidence to reject the claim that the mean lifetime of the newest model of battery is 15 years.
X
O Since the p-value is less than (or equal to) the level of significance, the null hypothesis is not rejected. So, there is
not enough evidence to reject the claim that the mean lifetime of the newest model of battery is 15 years.
O Since the p-value is greater than the level of significance, the null hypothesis is rejected. So, there is enough
evidence to reject the claim that the mean lifetime of the newest model of battery is 15 years.
O Since the p-value is greater than the level of significance, the null hypothesis is not rejected. So, there is not enough
evidence to reject the claim that the mean lifetime of the newest model of battery is 15 years.
Transcribed Image Text:A company that manufactures batteries used in electric cars is reporting that their newest model of battery has a mean lifetime, u, of 15 years. To test the
company's claim, a competitor has selected 62 of these batteries at random. The mean lifetime of the sample is 13.9 years. Suppose the population standard
deviation of these lifetimes is known to be 3.7 years.
Is there enough evidence to reject the claim that the mean lifetime of the newest model is 15 years? Perform a hypothesis test, using the 0.05 level of
significance.
(a) State the null hypothesis Ho and the alternative hypothesis H₁.
μ
X
Ho: O
H₁: 0
□<ロ OSO
O>O
020
0*0
?
Expert Solution
This question has been solved!
Explore an expertly crafted, step-by-step solution for a thorough understanding of key concepts.

Step by step
Solved in 3 steps

Recommended textbooks for you
MATLAB: An Introduction with Applications
Statistics
ISBN:
9781119256830
Author:
Amos Gilat
Publisher:
John Wiley & Sons Inc

Probability and Statistics for Engineering and th…
Statistics
ISBN:
9781305251809
Author:
Jay L. Devore
Publisher:
Cengage Learning

Statistics for The Behavioral Sciences (MindTap C…
Statistics
ISBN:
9781305504912
Author:
Frederick J Gravetter, Larry B. Wallnau
Publisher:
Cengage Learning
MATLAB: An Introduction with Applications
Statistics
ISBN:
9781119256830
Author:
Amos Gilat
Publisher:
John Wiley & Sons Inc
Probability and Statistics for Engineering and th…
Statistics
ISBN:
9781305251809
Author:
Jay L. Devore
Publisher:
Cengage Learning
Statistics for The Behavioral Sciences (MindTap C…
Statistics
ISBN:
9781305504912
Author:
Frederick J Gravetter, Larry B. Wallnau
Publisher:
Cengage Learning

Elementary Statistics: Picturing the World (7th E…
Statistics
ISBN:
9780134683416
Author:
Ron Larson, Betsy Farber
Publisher:
PEARSON

The Basic Practice of Statistics
Statistics
ISBN:
9781319042578
Author:
David S. Moore, William I. Notz, Michael A. Fligner
Publisher:
W. H. Freeman

Introduction to the Practice of Statistics
Statistics
ISBN:
9781319013387
Author:
David S. Moore, George P. McCabe, Bruce A. Craig
Publisher:
W. H. Freeman