Q3. Which measure shows the distance between the highest and the lowest value of a dataset? a) Range b) Inter-Quartile Range c) Coefficient of variation d) Mean
Q3. Which measure shows the distance between the highest and the lowest value of a dataset? a) Range b) Inter-Quartile Range c) Coefficient of variation d) Mean

Glencoe Algebra 1, Student Edition, 9780079039897, 0079039898, 2018
18th Edition
ISBN:9780079039897
Author:Carter
Publisher:Carter
Chapter10: Statistics
Section10.3: Measures Of Spread
Problem 1GP

Related questions
Question
Question 3-4 pls
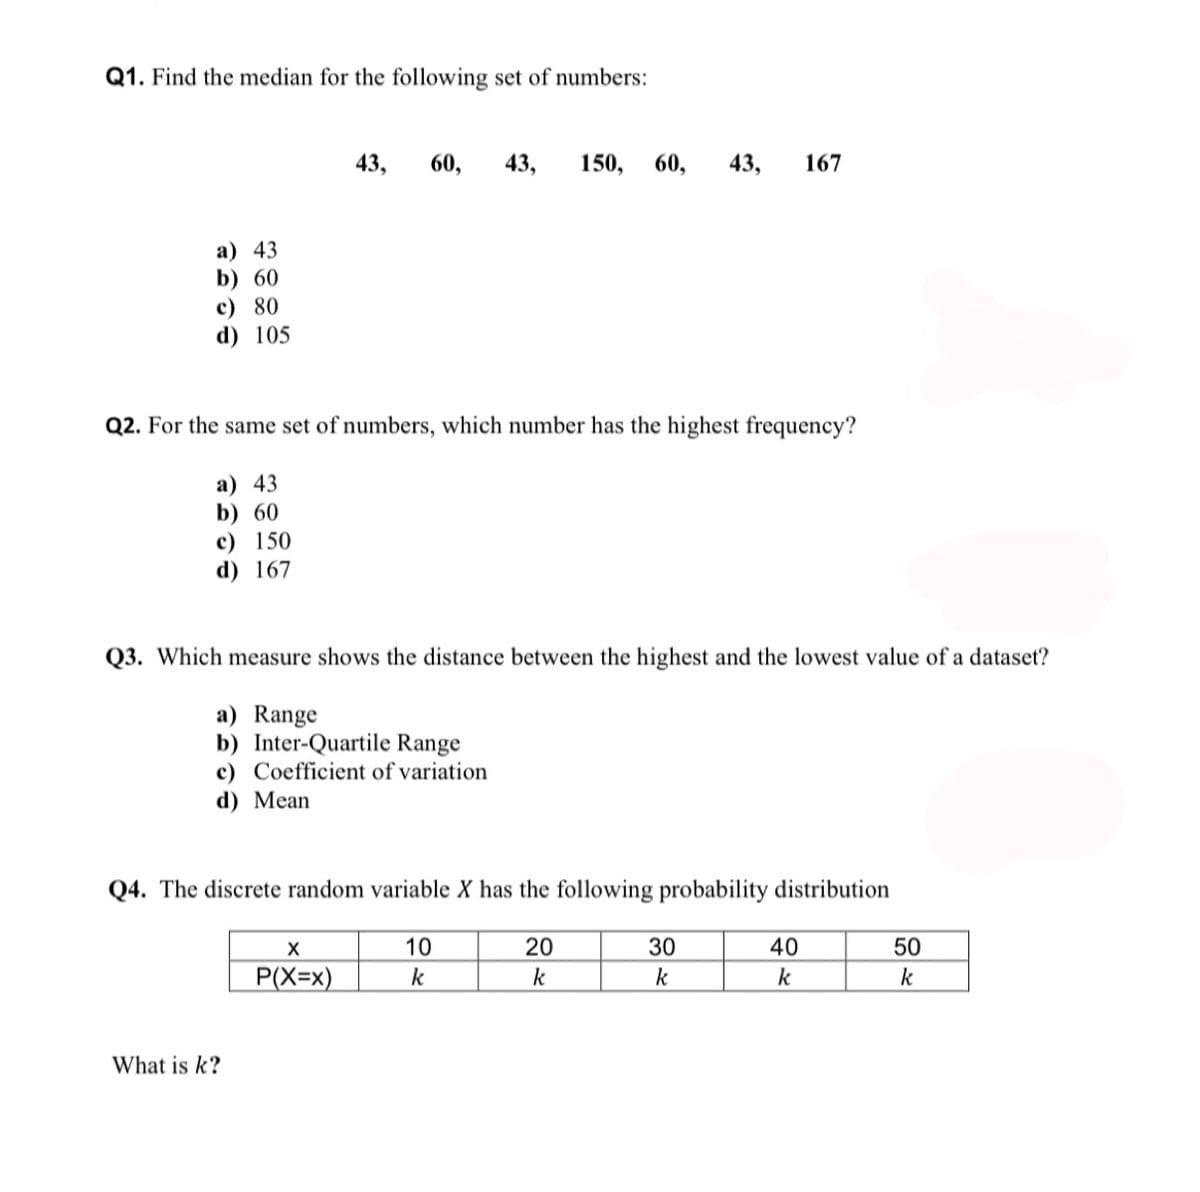
Transcribed Image Text:Q1. Find the median for the following set of numbers:
a) 43
b) 60
c) 80
d) 105
Q2. For the same set of numbers, which number has the highest frequency?
a) 43
b) 60
c) 150
d) 167
43, 60, 43, 150, 60, 43, 167
Q3. Which measure shows the distance between the highest and the lowest value of a dataset?
a) Range
b) Inter-Quartile Range
c) Coefficient of variation
d) Mean
Q4. The discrete random variable X has the following probability distribution
10
k
What is k?
X
P(X=x)
20
k
30
k
40
k
50
k
Expert Solution
This question has been solved!
Explore an expertly crafted, step-by-step solution for a thorough understanding of key concepts.

Step by step
Solved in 2 steps

Recommended textbooks for you
Glencoe Algebra 1, Student Edition, 9780079039897…
Algebra
ISBN:
9780079039897
Author:
Carter
Publisher:
McGraw Hill

Elementary Geometry For College Students, 7e
Geometry
ISBN:
9781337614085
Author:
Alexander, Daniel C.; Koeberlein, Geralyn M.
Publisher:
Cengage,
Glencoe Algebra 1, Student Edition, 9780079039897…
Algebra
ISBN:
9780079039897
Author:
Carter
Publisher:
McGraw Hill
Elementary Geometry For College Students, 7e
Geometry
ISBN:
9781337614085
Author:
Alexander, Daniel C.; Koeberlein, Geralyn M.
Publisher:
Cengage,