B. Identify the category of data, type of quantitative data* and scale of measurement of the given variables. (*please answer NOT APPLICABLE if your answer is qualitative) C. Identify the type of code appropriate for the given variable: 20. Age group 21. Blood type 22. Eye color 23. Home address 24. Use of drug
B. Identify the category of data, type of quantitative data* and scale of measurement of the given variables. (*please answer NOT APPLICABLE if your answer is qualitative) C. Identify the type of code appropriate for the given variable: 20. Age group 21. Blood type 22. Eye color 23. Home address 24. Use of drug

MATLAB: An Introduction with Applications
6th Edition
ISBN:9781119256830
Author:Amos Gilat
Publisher:Amos Gilat
Chapter1: Starting With Matlab
Section: Chapter Questions
Problem 1P

Related questions
Question
B. Identify the category of data, type of quantitative data* and scale of measurement of the given variables. (*please answer NOT APPLICABLE if your answer is qualitative)
C. Identify the type of code appropriate for the given variable:
20. Age group
21. Blood type
22. Eye color
23. Home address
24. Use of drug
Transcribed Image Text:4:49 A Y D
BIOE211 Worksheet # 1 -1 - Saved
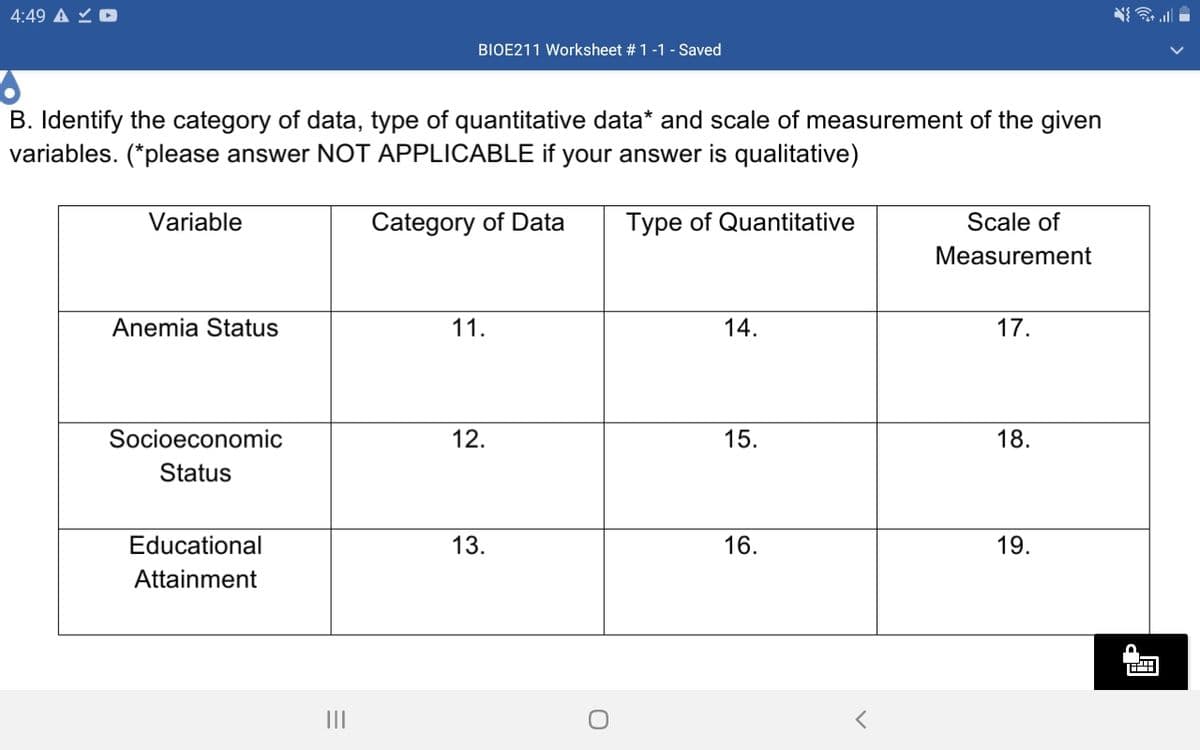
B. Identify the category of data, type of quantitative data* and scale of measurement of the given
variables. (*please answer NOT APPLICABLE if your answer is qualitative)
Variable
Category of Data
Type of Quantitative
Scale of
Measurement
Anemia Status
11.
14.
17.
Socioeconomic
12.
15.
18.
Status
Educational
13.
16.
19.
Attainment
II
Expert Solution
This question has been solved!
Explore an expertly crafted, step-by-step solution for a thorough understanding of key concepts.

Step by step
Solved in 2 steps

Recommended textbooks for you
MATLAB: An Introduction with Applications
Statistics
ISBN:
9781119256830
Author:
Amos Gilat
Publisher:
John Wiley & Sons Inc

Probability and Statistics for Engineering and th…
Statistics
ISBN:
9781305251809
Author:
Jay L. Devore
Publisher:
Cengage Learning

Statistics for The Behavioral Sciences (MindTap C…
Statistics
ISBN:
9781305504912
Author:
Frederick J Gravetter, Larry B. Wallnau
Publisher:
Cengage Learning
MATLAB: An Introduction with Applications
Statistics
ISBN:
9781119256830
Author:
Amos Gilat
Publisher:
John Wiley & Sons Inc
Probability and Statistics for Engineering and th…
Statistics
ISBN:
9781305251809
Author:
Jay L. Devore
Publisher:
Cengage Learning
Statistics for The Behavioral Sciences (MindTap C…
Statistics
ISBN:
9781305504912
Author:
Frederick J Gravetter, Larry B. Wallnau
Publisher:
Cengage Learning

Elementary Statistics: Picturing the World (7th E…
Statistics
ISBN:
9780134683416
Author:
Ron Larson, Betsy Farber
Publisher:
PEARSON

The Basic Practice of Statistics
Statistics
ISBN:
9781319042578
Author:
David S. Moore, William I. Notz, Michael A. Fligner
Publisher:
W. H. Freeman

Introduction to the Practice of Statistics
Statistics
ISBN:
9781319013387
Author:
David S. Moore, George P. McCabe, Bruce A. Craig
Publisher:
W. H. Freeman