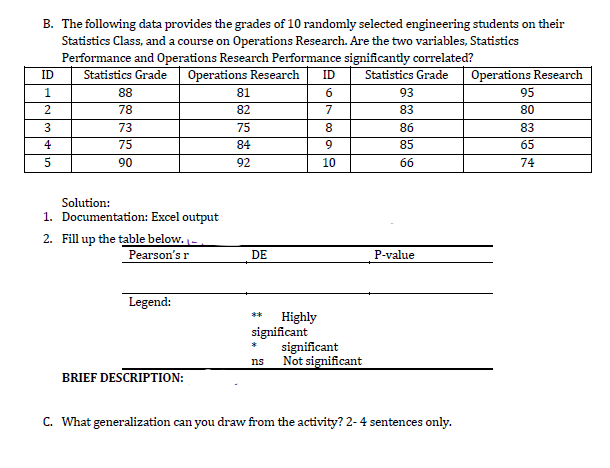
B. The following data provides the grades of 10 randomly selected engineering students on their Statistics Class, and a course on Operations Research. Are the two variables, Statistics Performance and Operations Research Performance significantly correlated? ID Statistics Grade Operations Research ID Statistics Grade Operations Research 88 81 6. 93 95 2 78 82 7 83 80 73 75 8. 86 83 4 75 84 85 65 90 92 10 66 74 Solution: 1. Documentation: Excel output 2. Fill up the table below. - Pearson's r DE P-value Legend: Highly significant significant ns Not significant BRIEF DESCRIPTION: C. What generalization can you draw from the activity? 2- 4 sentences only.
B. The following data provides the grades of 10 randomly selected engineering students on their Statistics Class, and a course on Operations Research. Are the two variables, Statistics Performance and Operations Research Performance significantly correlated? ID Statistics Grade Operations Research ID Statistics Grade Operations Research 88 81 6. 93 95 2 78 82 7 83 80 73 75 8. 86 83 4 75 84 85 65 90 92 10 66 74 Solution: 1. Documentation: Excel output 2. Fill up the table below. - Pearson's r DE P-value Legend: Highly significant significant ns Not significant BRIEF DESCRIPTION: C. What generalization can you draw from the activity? 2- 4 sentences only.

Linear Algebra: A Modern Introduction
4th Edition
ISBN:9781285463247
Author:David Poole
Publisher:David Poole
Chapter4: Eigenvalues And Eigenvectors
Section4.6: Applications And The Perron-frobenius Theorem
Problem 22EQ

Related questions
Question
ANSWER LETTER B AND C FOR THIS
Transcribed Image Text:II.
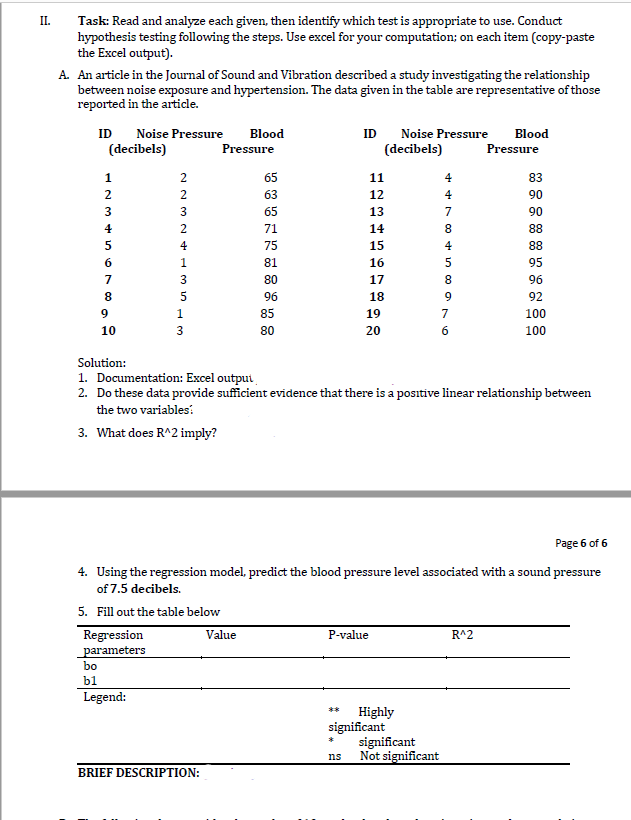
Task: Read and analyze each given, then identify which test is appropriate to use. Conduct
hypothesis testing following the steps. Use excel for your computation; on each item (copy-paste
the Excel output).
A. An article in the Journal of Sound and Vibration described a study investigating the relationship
between noise exposure and hypertension. The data given in the table are representative of those
reported in the article.
ID
Noise Pressure
Blood
ID
Noise Pressure
Blood
(decibels)
Pressure
(decibels)
Pressure
1
2
65
11
4
83
2
2
63
12
4
90
3
65
13
7
90
4
2
71
14
8
88
4
75
15
4
88
81
16
95
7
3
80
17
96
8
5
96
18
9
92
100
100
9
1
85
19
7
10
3
80
20
6
Solution:
1. Documentation: Excel output
2. Do these data provide sufficient evidence that there is a positive linear relationship between
the two variables:
3. What does R^2 imply?
Page 6 of 6
4. Using the regression model, predict the blood pressure level associated with a sound pressure
of 7.5 decibels.
5. Fill out the table below
P-value
Regression
parameters
bo
Value
R^2
b1
Legend:
Highly
significant
significant
Not significant
**
ns
BRIEF DESCRIPTION:
88
Transcribed Image Text:B. The following data provides the grades of 10 randomly selected engineering students on their
Statistics Class, and a course on Operations Research. Are the two variables, Statistics
Performance and Operations Research Performance significantly correlated?
Statistics Grade
Operations Research
Operations Research
ID
ID
Statistics Grade
1
88
81
93
95
78
82
7
83
80
3
73
75
8
86
83
4
75
84
9
85
65
5
90
92
10
66
74
Solution:
1. Documentation: Excel output
2. Fill up the table below. -
Pearson's r
DE
P-value
Legend:
Highly
significant
significant
Not significant
*本
ns
BRIEF DESCRIPTION:
C. What generalization can you draw from the activity? 2-4 sentences only.
Expert Solution
This question has been solved!
Explore an expertly crafted, step-by-step solution for a thorough understanding of key concepts.

Step by step
Solved in 2 steps with 1 images

Knowledge Booster


Learn more about
Need a deep-dive on the concept behind this application? Look no further. Learn more about this topic, statistics and related others by exploring similar questions and additional content below.Recommended textbooks for you
Linear Algebra: A Modern Introduction
Algebra
ISBN:
9781285463247
Author:
David Poole
Publisher:
Cengage Learning

Glencoe Algebra 1, Student Edition, 9780079039897…
Algebra
ISBN:
9780079039897
Author:
Carter
Publisher:
McGraw Hill
Linear Algebra: A Modern Introduction
Algebra
ISBN:
9781285463247
Author:
David Poole
Publisher:
Cengage Learning
Glencoe Algebra 1, Student Edition, 9780079039897…
Algebra
ISBN:
9780079039897
Author:
Carter
Publisher:
McGraw Hill