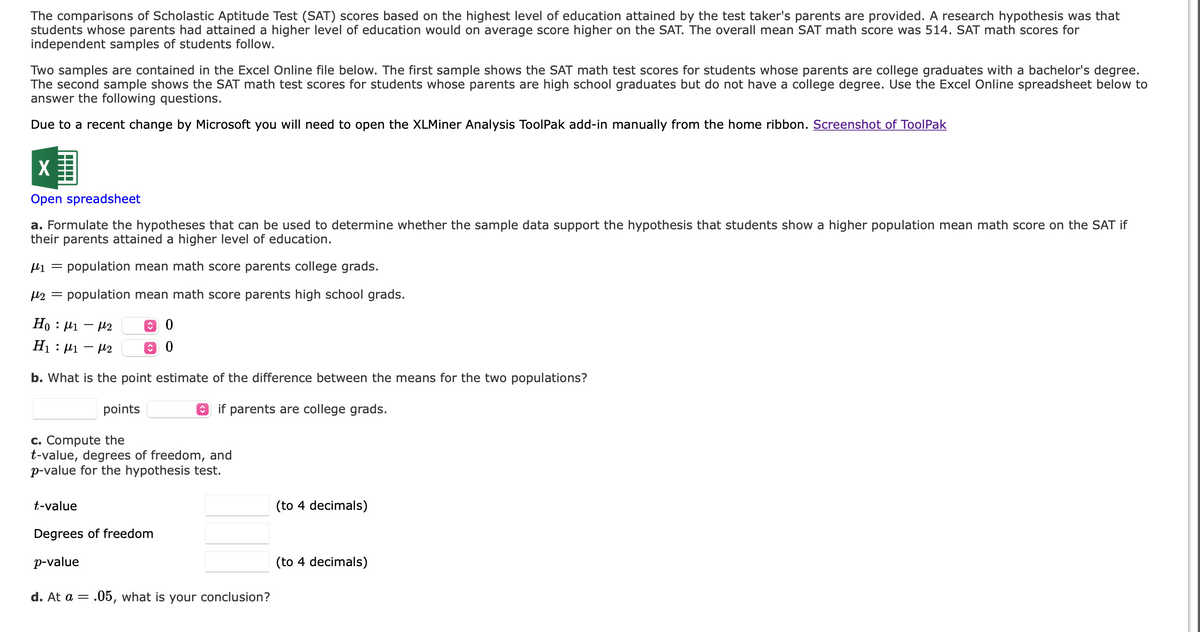
The comparisons of Scholastic Aptitude Test (SAT) scores based on the highest level of education attained by the test taker's parents are provided. A research hypothesis was that students whose parents had attained a higher level of education would on average score higher on the SAT. The overall mean SAT math score was 514. SAT math scores for independent samples of students follow. Two samples are contained in the Excel Online file below. The first sample shows the SAT math test scores for students whose parents are college graduates with a bachelor's degree. The second sample shows the SAT math test scores for students whose parents are high school graduates but do not have a college degree. Use the Excel Online spreadsheet below to answer the following questions. Due to a recent change by Microsoft you will need to open the XLMiner Analysis ToolPak add-in manually from the home ribbon. Screenshot of ToolPak X Open spreadsheet a. Formulate the hypotheses that can be used to determine whether the sample data support the hypothesis that students show a higher population mean math score on the SAT if their parents attained a higher level of education. ₁ population mean math score parents college grads. H2 = population mean math score parents high school grads. Ho: 1-2 H₁:11-12 b. What is the point estimate of the difference between the means for the two populations? if parents are college grads. points 0 0 c. Compute the t-value, degrees of freedom, and p-value for hypothesis test. t-value Degrees of freedom p-value d. At a = .05, what is your conclusion? (to 4 decimals) (to 4 decimals)
The comparisons of Scholastic Aptitude Test (SAT) scores based on the highest level of education attained by the test taker's parents are provided. A research hypothesis was that students whose parents had attained a higher level of education would on average score higher on the SAT. The overall mean SAT math score was 514. SAT math scores for independent samples of students follow. Two samples are contained in the Excel Online file below. The first sample shows the SAT math test scores for students whose parents are college graduates with a bachelor's degree. The second sample shows the SAT math test scores for students whose parents are high school graduates but do not have a college degree. Use the Excel Online spreadsheet below to answer the following questions. Due to a recent change by Microsoft you will need to open the XLMiner Analysis ToolPak add-in manually from the home ribbon. Screenshot of ToolPak X Open spreadsheet a. Formulate the hypotheses that can be used to determine whether the sample data support the hypothesis that students show a higher population mean math score on the SAT if their parents attained a higher level of education. ₁ population mean math score parents college grads. H2 = population mean math score parents high school grads. Ho: 1-2 H₁:11-12 b. What is the point estimate of the difference between the means for the two populations? if parents are college grads. points 0 0 c. Compute the t-value, degrees of freedom, and p-value for hypothesis test. t-value Degrees of freedom p-value d. At a = .05, what is your conclusion? (to 4 decimals) (to 4 decimals)

Algebra: Structure And Method, Book 1
(REV)00th Edition
ISBN:9780395977224
Author:Richard G. Brown, Mary P. Dolciani, Robert H. Sorgenfrey, William L. Cole
Publisher:Richard G. Brown, Mary P. Dolciani, Robert H. Sorgenfrey, William L. Cole
Chapter2: Working With Real Numbers
Section2.9: Dividing Real Numbers
Problem 8E

Related questions
Question
Transcribed Image Text:123456789
10
11
12
13
14
15
16
17
18
19
20
21
22
23
24
25
26
27
28
29
30
31
32
33
<
A
B
College High School
496
528
496
592
544
512
656
528
480
576
560
656
496
624
640
608
=
420
432
432
564
528
588
456
516
432
396
420
552
Data
+
с
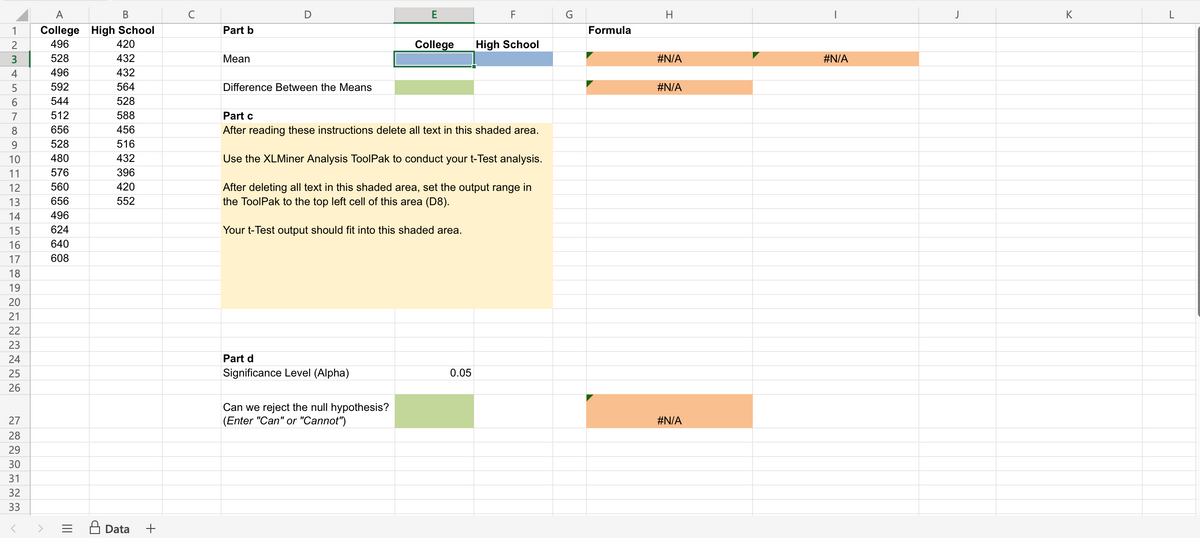
Part b
Mean
D
Difference Between the Means
Part d
Significance Level (Alpha)
E
Can we reject the null hypothesis?
(Enter "Can" or "Cannot")
College
Part c
After reading these instructions delete all text in this shaded area.
Use the XLMiner Analysis ToolPak to conduct your t-Test analysis.
After deleting all text in this shaded area, set the output range in
the ToolPak to the top left cell of this area (D8).
Your t-Test output should fit into this shaded area.
F
0.05
High School
Formula
H
#N/A
#N/A
#N/A
#N/A
J
K
L
Transcribed Image Text:The comparisons of Scholastic Aptitude Test (SAT) scores based on the highest level of education attained by the test taker's parents are provided. A research hypothesis was that
students whose parents had attained a higher level of education would on average score higher on the SAT. The overall mean SAT math score was 514. SAT math scores for
independent samples of students follow.
Two samples are contained in the Excel Online file below. The first sample shows the SAT math test scores for students whose parents are college graduates with a bachelor's degree.
The second sample shows the SAT math test scores for students whose parents are high school graduates but do not have a college degree. Use the Excel Online spreadsheet below to
answer the following questions.
Due to a recent change by Microsoft you will need to open the XLMiner Analysis ToolPak add-in manually from the home ribbon. Screenshot of ToolPak
X
Open spreadsheet
a. Formulate the hypotheses that can be used to determine whether the sample data support the hypothesis that students show a higher population mean math score on the SAT if
their parents attained a higher level of education.
μ₁ = population mean math score parents college grads.
μ₂ =
population mean math score parents high school grads.
Ho: μ1 - μ2
H₁ μ1 μ2
b. What is the point estimate of the difference between the means for the two populations?
if parents are college grads.
points
î
c. Compute the
t-value, degrees of freedom, and
p-value for the hypothesis test.
t-value
Degrees of freedom
p-value
d. At a = .05, what is your conclusion?
(to 4 decimals)
(to 4 decimals)
Expert Solution
This question has been solved!
Explore an expertly crafted, step-by-step solution for a thorough understanding of key concepts.

This is a popular solution!

Trending now
This is a popular solution!

Step by step
Solved in 6 steps with 3 images

Follow-up Questions
Read through expert solutions to related follow-up questions below.
Follow-up Question
part c is completely wrong. please provide correct answers!!
Solution
Recommended textbooks for you
Algebra: Structure And Method, Book 1
Algebra
ISBN:
9780395977224
Author:
Richard G. Brown, Mary P. Dolciani, Robert H. Sorgenfrey, William L. Cole
Publisher:
McDougal Littell


Holt Mcdougal Larson Pre-algebra: Student Edition…
Algebra
ISBN:
9780547587776
Author:
HOLT MCDOUGAL
Publisher:
HOLT MCDOUGAL
Algebra: Structure And Method, Book 1
Algebra
ISBN:
9780395977224
Author:
Richard G. Brown, Mary P. Dolciani, Robert H. Sorgenfrey, William L. Cole
Publisher:
McDougal Littell
Holt Mcdougal Larson Pre-algebra: Student Edition…
Algebra
ISBN:
9780547587776
Author:
HOLT MCDOUGAL
Publisher:
HOLT MCDOUGAL


College Algebra (MindTap Course List)
Algebra
ISBN:
9781305652231
Author:
R. David Gustafson, Jeff Hughes
Publisher:
Cengage Learning

Algebra and Trigonometry (MindTap Course List)
Algebra
ISBN:
9781305071742
Author:
James Stewart, Lothar Redlin, Saleem Watson
Publisher:
Cengage Learning