Back to Assignment Attempts: Keep the Highest: 1/4 3. The relationship between marginal and average costs Consider the following scenario to understand the relationship between marginal and average values. Suppose Edison is a professional basketball player, and his game log for free throws can be summarized in the following table. Fill in the columns with Edison's free-throw percentage for each game and his overall free-throw average after each game. Game Game Result Total Game Free-Throw Percentage Average Free-Throw Percentage 3/3 3/3 100 100 3/5 6/8 80 3 2/8 8/16 4 2/4 10/20 5/5 15/25 On the following graph, use the orange points (square symbol) to plot Edison's free-throw percentage for each game individually, and use the green points (triangle symbol) to plot his overall average free-throw percentage after each game. Note: Plot your points in the order in which you would like them connected. Line segments will connect the points automatically. 100 T HW#4 (Costs of Production, Competitive Markets) On the following graph, use the orange points (square symbol) to plot Edison's free-throw percentage for each game individually, and use the green points (triangle symbol) to plot his overall average free-throw percentage after each game. Note: Plot your points in the order in which you would like them connected. Line segments will connect the points automatically. 100 90 Game Free-Throw Percentage 90 70 60 Average Free-Throw Percentage 40 30 20 10 GAME You can think of the result in any one game as being Edison's marginal free-throw percentage. Based on your previous answer, you can deduce that when Edison's marginal free-throw percentage is below the average, the average must be You can now apply this analysis to production costs. For a U-shaped average total cost (ATC) curve, when the marginal cost curve is below the average total cost curve, the average total cost must be Also, when the marginal cost curve is above the average total cost curve, the average total cost must be . Therefore, the marginal cost curve intersects the average total cost curve FREE-THROW PERCENTAGE
Back to Assignment Attempts: Keep the Highest: 1/4 3. The relationship between marginal and average costs Consider the following scenario to understand the relationship between marginal and average values. Suppose Edison is a professional basketball player, and his game log for free throws can be summarized in the following table. Fill in the columns with Edison's free-throw percentage for each game and his overall free-throw average after each game. Game Game Result Total Game Free-Throw Percentage Average Free-Throw Percentage 3/3 3/3 100 100 3/5 6/8 80 3 2/8 8/16 4 2/4 10/20 5/5 15/25 On the following graph, use the orange points (square symbol) to plot Edison's free-throw percentage for each game individually, and use the green points (triangle symbol) to plot his overall average free-throw percentage after each game. Note: Plot your points in the order in which you would like them connected. Line segments will connect the points automatically. 100 T HW#4 (Costs of Production, Competitive Markets) On the following graph, use the orange points (square symbol) to plot Edison's free-throw percentage for each game individually, and use the green points (triangle symbol) to plot his overall average free-throw percentage after each game. Note: Plot your points in the order in which you would like them connected. Line segments will connect the points automatically. 100 90 Game Free-Throw Percentage 90 70 60 Average Free-Throw Percentage 40 30 20 10 GAME You can think of the result in any one game as being Edison's marginal free-throw percentage. Based on your previous answer, you can deduce that when Edison's marginal free-throw percentage is below the average, the average must be You can now apply this analysis to production costs. For a U-shaped average total cost (ATC) curve, when the marginal cost curve is below the average total cost curve, the average total cost must be Also, when the marginal cost curve is above the average total cost curve, the average total cost must be . Therefore, the marginal cost curve intersects the average total cost curve FREE-THROW PERCENTAGE

Principles of Economics 2e
2nd Edition
ISBN:9781947172364
Author:Steven A. Greenlaw; David Shapiro
Publisher:Steven A. Greenlaw; David Shapiro
Chapter7: Production, Costs, And Industry Structure
Section: Chapter Questions
Problem 42P: A small company that shovels sidewalks and driveways has 100 homes signed up for its services this...

Related questions
Question
Transcribed Image Text:Back to Assignment
Attempts:
Keep the Highest: 1/4
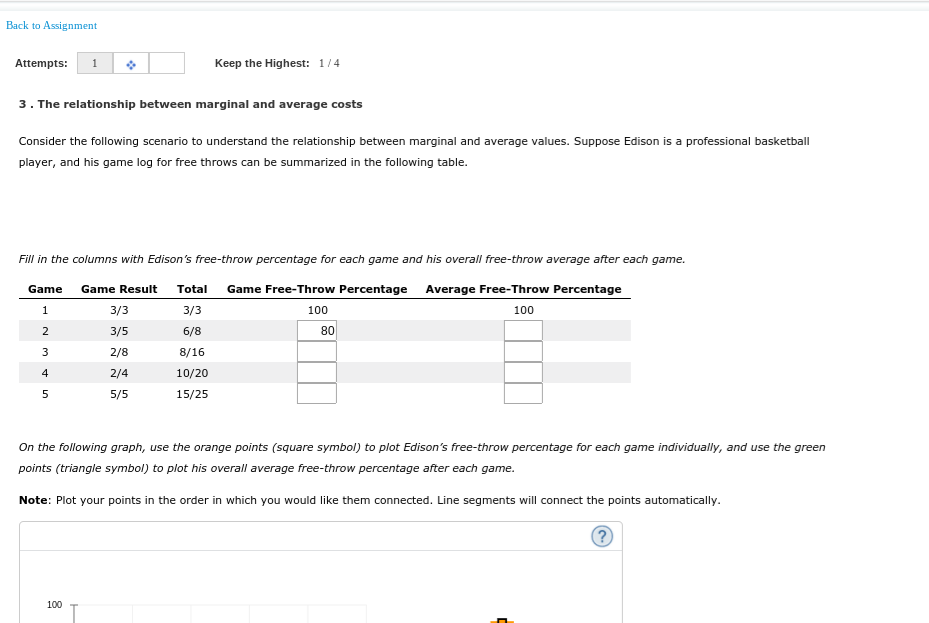
3. The relationship between marginal and average costs
Consider the following scenario to understand the relationship between marginal and average values. Suppose Edison is a professional basketball
player, and his game log for free throws can be summarized in the following table.
Fill in the columns with Edison's free-throw percentage for each game and his overall free-throw average after each game.
Game
Game Result
Total Game Free-Throw Percentage Average Free-Throw Percentage
3/3
3/3
100
100
3/5
6/8
80
3
2/8
8/16
4
2/4
10/20
5/5
15/25
On the following graph, use the orange points (square symbol) to plot Edison's free-throw percentage for each game individually, and use the green
points (triangle symbol) to plot his overall average free-throw percentage after each game.
Note: Plot your points in the order in which you would like them connected. Line segments will connect the points automatically.
100 T
Transcribed Image Text:HW#4 (Costs of Production, Competitive Markets)
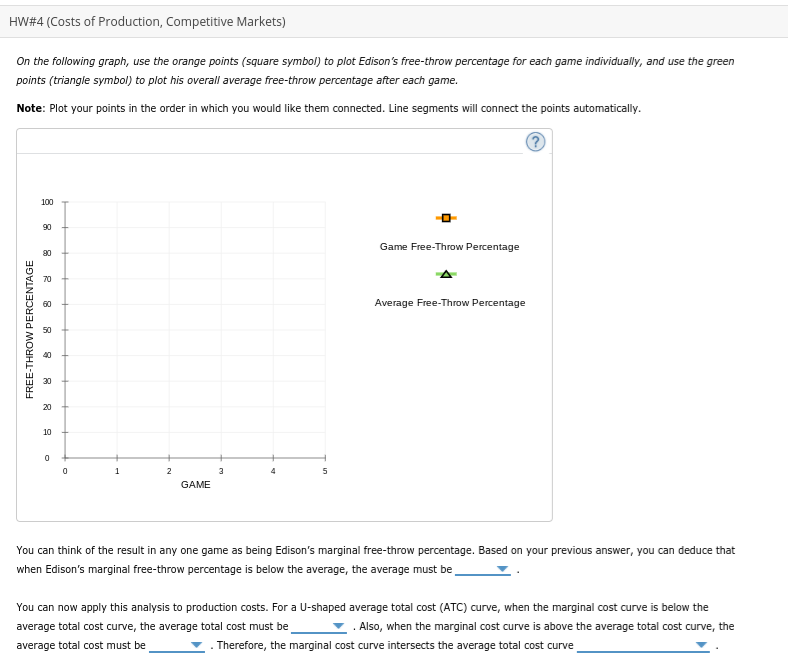
On the following graph, use the orange points (square symbol) to plot Edison's free-throw percentage for each game individually, and use the green
points (triangle symbol) to plot his overall average free-throw percentage after each game.
Note: Plot your points in the order in which you would like them connected. Line segments will connect the points automatically.
100
90
Game Free-Throw Percentage
90
70
60
Average Free-Throw Percentage
40
30
20
10
GAME
You can think of the result in any one game as being Edison's marginal free-throw percentage. Based on your previous answer, you can deduce that
when Edison's marginal free-throw percentage is below the average, the average must be
You can now apply this analysis to production costs. For a U-shaped average total cost (ATC) curve, when the marginal cost curve is below the
average total cost curve, the average total cost must be
Also, when the marginal cost curve is above the average total cost curve, the
average total cost must be
. Therefore, the marginal cost curve intersects the average total cost curve
FREE-THROW PERCENTAGE
Expert Solution
This question has been solved!
Explore an expertly crafted, step-by-step solution for a thorough understanding of key concepts.

This is a popular solution!

Trending now
This is a popular solution!

Step by step
Solved in 4 steps with 2 images

Recommended textbooks for you
Principles of Economics 2e
Economics
ISBN:
9781947172364
Author:
Steven A. Greenlaw; David Shapiro
Publisher:
OpenStax

Managerial Economics: A Problem Solving Approach
Economics
ISBN:
9781337106665
Author:
Luke M. Froeb, Brian T. McCann, Michael R. Ward, Mike Shor
Publisher:
Cengage Learning

Managerial Economics: Applications, Strategies an…
Economics
ISBN:
9781305506381
Author:
James R. McGuigan, R. Charles Moyer, Frederick H.deB. Harris
Publisher:
Cengage Learning
Principles of Economics 2e
Economics
ISBN:
9781947172364
Author:
Steven A. Greenlaw; David Shapiro
Publisher:
OpenStax
Managerial Economics: A Problem Solving Approach
Economics
ISBN:
9781337106665
Author:
Luke M. Froeb, Brian T. McCann, Michael R. Ward, Mike Shor
Publisher:
Cengage Learning
Managerial Economics: Applications, Strategies an…
Economics
ISBN:
9781305506381
Author:
James R. McGuigan, R. Charles Moyer, Frederick H.deB. Harris
Publisher:
Cengage Learning


Essentials of Economics (MindTap Course List)
Economics
ISBN:
9781337091992
Author:
N. Gregory Mankiw
Publisher:
Cengage Learning