BALANCE SHEET Tenaga National Berhad Inc. Income Statement (in million except per share data, and as percentage of sales) for the year ended 31st. August 2015, 31st. August 2016 and 31st August 2017 LIABILITIES CURRENT LIABILITIES Payables Finance lease payables -6,898.6 -8,786.9 -1,417.2 -6,641.1 RM'million -1,378.5 -1,149.1 2015 2016 2017 Derivative financial instruments -0.40 Assets Deferred income -1,143.9 -1,132.9 -1,029.3 -1,384.9 NON-CURRENT ASSETS Amounts due to subsidiaries -752.2 -1,258.1 73,114.4 5,152.4 74,916.3 Property, plant and equipment Subsidiaries 75,841.9 Amounts due to associates -531.4 -549.8 -628,9 7,626.2 10,081.5 Current tax liabilities -44.3 -47.0 -58.7 Joint ventures Employee benefits Short term borrowings -702.8 -747.6 -738.3 Associates 70.3 70.3 70.3 -1,327.0 -242.0 -290.4 Goodwill on consolidation Total - 12,778.7 -13,953.1 -12,149.5 Investment in unquoted debt security Tax recoverable Deferred tax assets 24.3 15.4 1,693.2 1,693.2 1.765.1 NET CURRENT ASSETS -176.0 954.8 6,892.1 Long term receivables Amounts due from subsidiaries 1,236.0 721.3 694.1 TOTAL ASSETS LESS CURRENT LIABILITIES 86000.7 91560.2 101,112.4 534.7 455.0 Finance lease receivable NON-CURRENT LIABILITIES Prepaid operating leases Borrowings Consumer deposits Finance lease payables Deferred income 4848.1 4990.0 5241.2 -9,117.0 -10,520.9 -15,686.6 -3,938.7 -13,141.8 -4,284.0 -4,778.2 -10,722.4 Available-for-sale financial assets 38.0 38.0 71.2 Total 86176.7 90605.4 94220.3 -11,724.7 -1,150.4 -920,7 -691.5 CURRENT ASSETS Other liabilities -624.8 -581.6 -631.7 Deferred tax liabilities -5,430.1 -9,863.5 Non-current assets held-for-sale -5,472.3 -6,339.9 Employee benefits Government development grants Inventories 254.7 236.1 261.9 -10,579.8 -10,442.5 Receivables, deposits and prepayments 5,432.1 5,875.4 6,119.1 Tax recoverable Total -43,266.3 -44,084.0 -49,292.8 Finance lease receivable TOTAL NET ASSETS 42,734.4 47,476.2 51,819.6 Prepaid operating leases 130.9 130.9 129.0 TOTAL LIABILITY 56,045.0 58,037.1 61,442.3 Amounts due from subsidiaries 2,534.1 1,996.8 3,097.3 Amounts due from joint ventures EQUITY Share capital Share premium Amounts due from associates 58.9 18.4 1 5,643.6 5,382.2 5,643.6 11,124.9 Derivative financial instruments 3.5 5,382.2 Financial assets at fair value through profit or loss ('FVTPL') Deposits, bank and cash balances Other reserves -4,875.7 -5,258.2 -5,190.9 6,097.9 3,335,4 3,640.2 4.693.3 Retained profits 36,584.3 41,708.6 45,885.6 551.8 1,953.5 CAPITAL AND RESERVES ATTRIBUTABLE TO Total 12,602.7 14,907.9 19.041.6 OWNERS OF THE COMPANY 42,734.4 47,476.2 51,819.6 TOTAL ASSETS 98,779.4 105,513.3 113,261.9 NON-CONTROLLING INTERESTS ('NCI') TOTAL EQUITY 42,734.4 47,476.2 51,819.6 TOTAL LIABILITIES AND EQUITY 98,779.4 105,513.3 113,261.9
BALANCE SHEET Tenaga National Berhad Inc. Income Statement (in million except per share data, and as percentage of sales) for the year ended 31st. August 2015, 31st. August 2016 and 31st August 2017 LIABILITIES CURRENT LIABILITIES Payables Finance lease payables -6,898.6 -8,786.9 -1,417.2 -6,641.1 RM'million -1,378.5 -1,149.1 2015 2016 2017 Derivative financial instruments -0.40 Assets Deferred income -1,143.9 -1,132.9 -1,029.3 -1,384.9 NON-CURRENT ASSETS Amounts due to subsidiaries -752.2 -1,258.1 73,114.4 5,152.4 74,916.3 Property, plant and equipment Subsidiaries 75,841.9 Amounts due to associates -531.4 -549.8 -628,9 7,626.2 10,081.5 Current tax liabilities -44.3 -47.0 -58.7 Joint ventures Employee benefits Short term borrowings -702.8 -747.6 -738.3 Associates 70.3 70.3 70.3 -1,327.0 -242.0 -290.4 Goodwill on consolidation Total - 12,778.7 -13,953.1 -12,149.5 Investment in unquoted debt security Tax recoverable Deferred tax assets 24.3 15.4 1,693.2 1,693.2 1.765.1 NET CURRENT ASSETS -176.0 954.8 6,892.1 Long term receivables Amounts due from subsidiaries 1,236.0 721.3 694.1 TOTAL ASSETS LESS CURRENT LIABILITIES 86000.7 91560.2 101,112.4 534.7 455.0 Finance lease receivable NON-CURRENT LIABILITIES Prepaid operating leases Borrowings Consumer deposits Finance lease payables Deferred income 4848.1 4990.0 5241.2 -9,117.0 -10,520.9 -15,686.6 -3,938.7 -13,141.8 -4,284.0 -4,778.2 -10,722.4 Available-for-sale financial assets 38.0 38.0 71.2 Total 86176.7 90605.4 94220.3 -11,724.7 -1,150.4 -920,7 -691.5 CURRENT ASSETS Other liabilities -624.8 -581.6 -631.7 Deferred tax liabilities -5,430.1 -9,863.5 Non-current assets held-for-sale -5,472.3 -6,339.9 Employee benefits Government development grants Inventories 254.7 236.1 261.9 -10,579.8 -10,442.5 Receivables, deposits and prepayments 5,432.1 5,875.4 6,119.1 Tax recoverable Total -43,266.3 -44,084.0 -49,292.8 Finance lease receivable TOTAL NET ASSETS 42,734.4 47,476.2 51,819.6 Prepaid operating leases 130.9 130.9 129.0 TOTAL LIABILITY 56,045.0 58,037.1 61,442.3 Amounts due from subsidiaries 2,534.1 1,996.8 3,097.3 Amounts due from joint ventures EQUITY Share capital Share premium Amounts due from associates 58.9 18.4 1 5,643.6 5,382.2 5,643.6 11,124.9 Derivative financial instruments 3.5 5,382.2 Financial assets at fair value through profit or loss ('FVTPL') Deposits, bank and cash balances Other reserves -4,875.7 -5,258.2 -5,190.9 6,097.9 3,335,4 3,640.2 4.693.3 Retained profits 36,584.3 41,708.6 45,885.6 551.8 1,953.5 CAPITAL AND RESERVES ATTRIBUTABLE TO Total 12,602.7 14,907.9 19.041.6 OWNERS OF THE COMPANY 42,734.4 47,476.2 51,819.6 TOTAL ASSETS 98,779.4 105,513.3 113,261.9 NON-CONTROLLING INTERESTS ('NCI') TOTAL EQUITY 42,734.4 47,476.2 51,819.6 TOTAL LIABILITIES AND EQUITY 98,779.4 105,513.3 113,261.9

Financial Accounting: The Impact on Decision Makers
10th Edition
ISBN:9781305654174
Author:Gary A. Porter, Curtis L. Norton
Publisher:Gary A. Porter, Curtis L. Norton
Chapter10: Long-term Liabilities
Section: Chapter Questions
Problem 10.9MCP

Related questions
Question
1. Calculate inventory turnover ratio, average collection period ratio and fixed assetd turnover ratio for year 2015, 2016 and 2017.
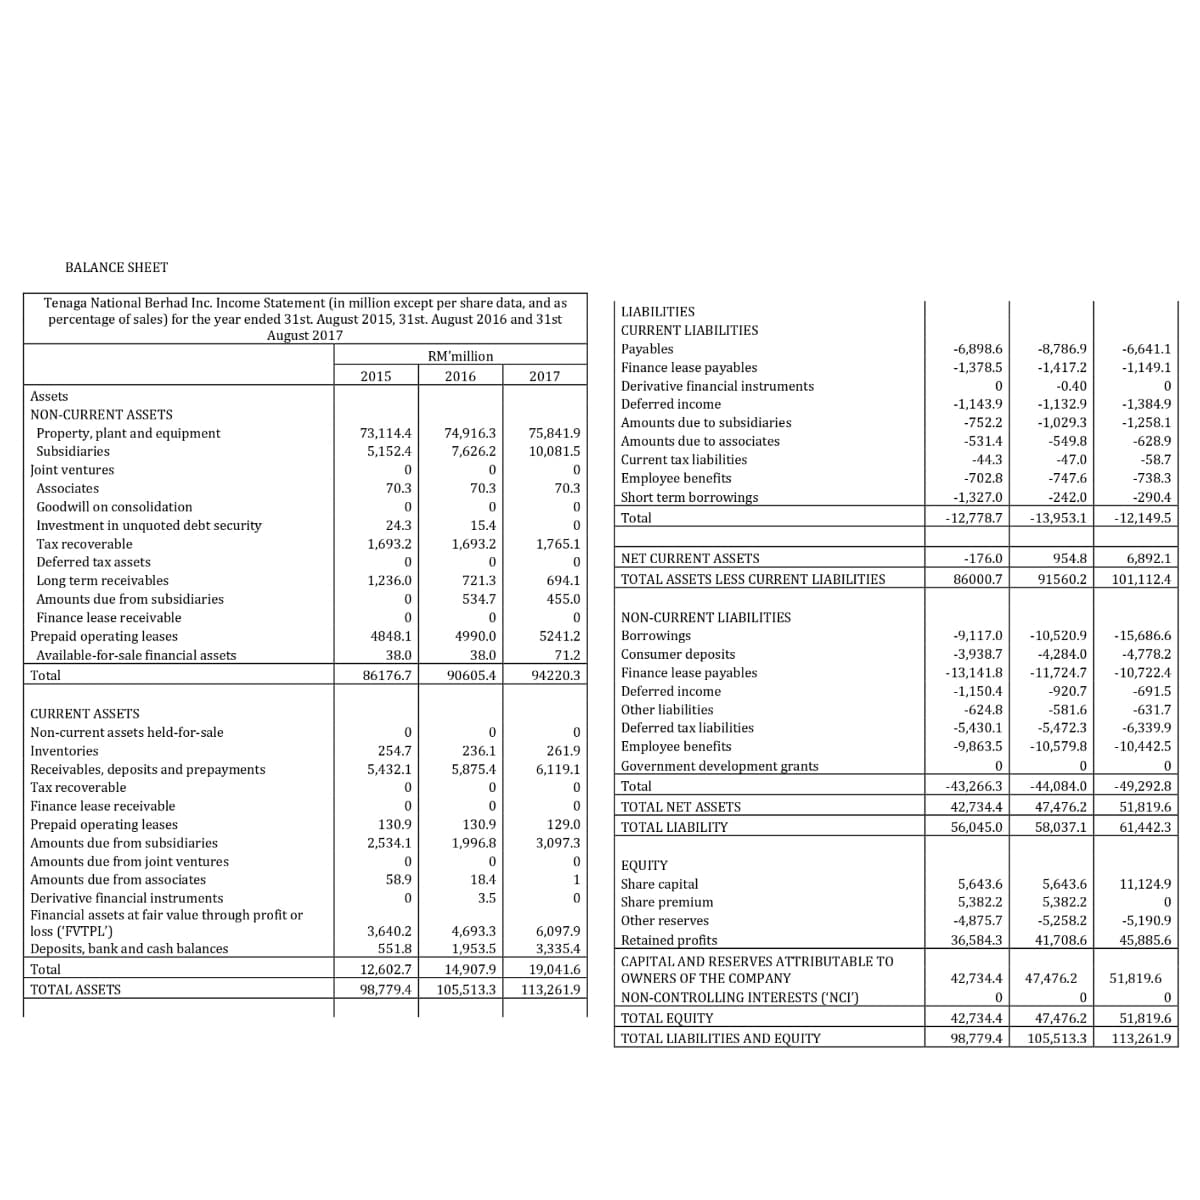
Transcribed Image Text:BALANCE SHEET
Tenaga National Berhad Inc. Income Statement (in million except per share data, and as
percentage of sales) for the year ended 31st. August 2015, 31st. August 2016 and 31st
August 2017
LIABILITIES
CURRENT LIABILITIES
Payables
Finance lease payables
-6,898.6
-8,786.9
-6,641.1
RM'million
-1,378.5
-1,417.2
-1,149.1
2015
2016
2017
Derivative financial instruments
-0.40
Assets
Deferred income
-1,143.9
-1,132.9
-1,384.9
NON-CURRENT ASSETS
Amounts due to subsidiaries
-752.2
-1,029.3
-1,258.1
74,916.3
Property, plant and equipment
Subsidiaries
73,114.4
75,841.9
Amounts due to associates
-531.4
-549.8
-628.9
5,152.4
7,626.2
10,081.5
Current tax liabilities
-44.3
-47.0
-58.7
Joint ventures
Employee benefits
-702.8
-747.6
-738.3
Associates
70.3
70.3
70.3
Short term borrowings
-1,327.0
-242.0
-290.4
Goodwill on consolidation
Total
-12,778.7
-13,953.1
-12,149.5
Investment in unquoted debt security
24.3
15.4
Tax recoverable
1,693.2
1,693.2
1,765.1
Deferred tax assets
NET CURRENT ASSETS
-176.0
954.8
6,892.1
Long term receivables
1,236.0
721.3
694.1
TOTAL ASSETS LESS CURRENT LIABILITIES
86000,7
91560.2
101,112.4
Amounts due from subsidiaries
534.7
455.0
Finance lease receivable
NON-CURRENT LIABILITIES
4990.0
5241.2
-15,686.6
-4,778.2
4848.1
Borrowings
Consumer deposits
Finance lease payables
Prepaid operating leases
-9,117.0
-10,520.9
Available-for-sale financial assets
38.0
38.0
71.2
-3,938.7
-4,284.0
Total
86176.7
90605.4
94220.3
-13,141.8
-11.724.7
-10,722.4
Deferred income
-1,150.4
-920.7
-691.5
-624.8
-5,430.1
CURRENT ASSETS
Other liabilities
-581.6
-631.7
Non-current assets held-for-sale
Deferred tax liabilities
-5,472.3
-6,339.9
Employee benefits
Government development grants
Inventories
254.7
236.1
261.9
-9,863.5
-10,579.8
-10,442.5
Receivables, deposits and prepayments
5,432.1
5,875.4
6,119.1
Tax recoverable
Total
-43,266.3
-44,084.0
-49,292.8
Finance lease receivable
TOTAL NET ASSETS
42,734.4
47,476.2
51,819.6
Prepaid operating leases
130,9
130.9
129.0
TOTAL LIABILITY
56,045.0
58,037.1
61,442.3
Amounts due from subsidiaries
2,534.1
1,996.8
3,097.3
Amounts due from joint ventures
EQUITY
Share capital
Share premium
Amounts due from associates
58.9
18.4
1
5,643.6
5,643.6
11,124.9
Derivative financial instruments
Financial assets at fair value through profit or
loss ('FVTPL')
Deposits, bank and cash balances
3.5
5,382.2
5.382.2
Other reserves
-4,875.7
-5,258.2
-5,190.9
3,640.2
4.693.3
6,097.9
Retained profits
36.584.3
41,708.6
45,885.6
551.8
1,953,5
3.335.4
CAPITAL AND RESERVES ATTRIBUTABLE TO
Total
12,602.7
14,907.9
19,041.6
OWNERS OF THE COMPANY
42.734.4
47,476.2
51,819.6
TOTAL ASSETS
98,779.4
105,513.3
113,261.9
NON-CONTROLLING INTERESTS ('NCI')
TOTAL EQUITY
42,734.4
47,476.2
51,819.6
TOTAL LIABILITIES AND EQUITY
98.779.4
105,513.3
113.261.9
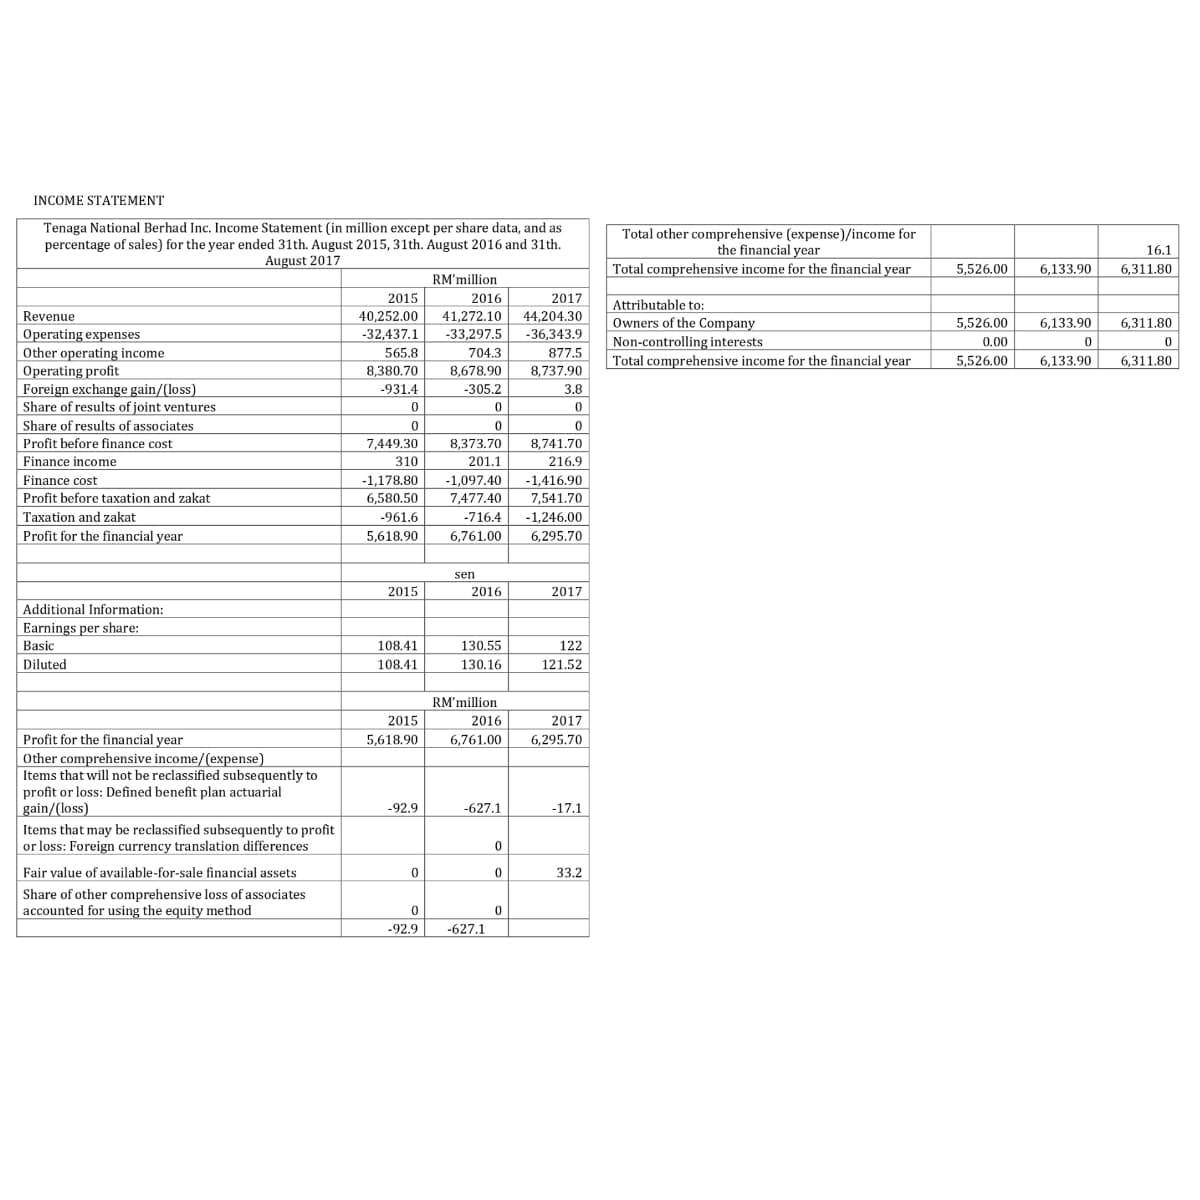
Transcribed Image Text:INCOME STATEMENT
Tenaga National Berhad Inc. Income Statement (in million except per share data, and as
percentage of sales) for the year ended 31th. August 2015, 31th. August 2016 and 31th.
August 2017
Total other comprehensive (expense)/income for
the financial year
16.1
Total comprehensive income for the financial year
5,526.00
6.133.90
6.311.80
RM'million
2015
2016
2017
Attributable to:
Owners of the Company
Non-controlling interests
Total comprehensive income for the financial year
Revenue
40,252.00
41,272.10 44,204.30
5,526.00
6,133.90
6,311.80
Operating expenses
Other operating income
Operating profit
Foreign exchange gain/(loss)
Share of results of joint ventures
Share of results of associates
-32,437.1
-33,297.5
-36,343.9
0,00
565.8
704.3
877.5
5,526.00
6,133.90
6,311.80
8.380.70
8,678.90
8,737.90
-931.4
-305.2
3.8
Profit before finance cost
7,449.30
8,373.70
8,741.70
Finance income
Finance cost
310
201.1
216.9
-1,178.80
-1,097.40
-1,416.90
7,541.70
Profit before taxation and zakat
6,580.50
7,477.40
Taxation and zakat
-961.6
-716.4
-1.246.00
Profit for the financial year
5,618.90
6,761.00
6,295.70
sen
2015
2016
2017
Additional Information:
Earnings per share:
Basic
108.41
130.55
122
Diluted
108.41
130.16
121.52
RM'million
2015
2016
2017
Profit for the financial year
5,618.90
6.761.00
6,295.70
Other comprehensive income/(expense)
Items that will not be reclassified subsequently to
profit or loss: Defined benefit plan actuarial
gain/(loss)
Items that may be reclassified subsequently to profit
or loss: Foreign currency translation differences
-92.9
-627.1
-17.1
Fair value of available-for-sale financial assets
33.2
Share of other comprehensive loss of associates
accounted for using the equity method
-92.9
-627.1
Expert Solution
This question has been solved!
Explore an expertly crafted, step-by-step solution for a thorough understanding of key concepts.

Step by step
Solved in 2 steps

Knowledge Booster


Learn more about
Need a deep-dive on the concept behind this application? Look no further. Learn more about this topic, accounting and related others by exploring similar questions and additional content below.Recommended textbooks for you
Financial Accounting: The Impact on Decision Make…
Accounting
ISBN:
9781305654174
Author:
Gary A. Porter, Curtis L. Norton
Publisher:
Cengage Learning

Managerial Accounting: The Cornerstone of Busines…
Accounting
ISBN:
9781337115773
Author:
Maryanne M. Mowen, Don R. Hansen, Dan L. Heitger
Publisher:
Cengage Learning

Financial & Managerial Accounting
Accounting
ISBN:
9781285866307
Author:
Carl Warren, James M. Reeve, Jonathan Duchac
Publisher:
Cengage Learning
Financial Accounting: The Impact on Decision Make…
Accounting
ISBN:
9781305654174
Author:
Gary A. Porter, Curtis L. Norton
Publisher:
Cengage Learning
Managerial Accounting: The Cornerstone of Busines…
Accounting
ISBN:
9781337115773
Author:
Maryanne M. Mowen, Don R. Hansen, Dan L. Heitger
Publisher:
Cengage Learning
Financial & Managerial Accounting
Accounting
ISBN:
9781285866307
Author:
Carl Warren, James M. Reeve, Jonathan Duchac
Publisher:
Cengage Learning

Cornerstones of Financial Accounting
Accounting
ISBN:
9781337690881
Author:
Jay Rich, Jeff Jones
Publisher:
Cengage Learning

Intermediate Accounting: Reporting And Analysis
Accounting
ISBN:
9781337788281
Author:
James M. Wahlen, Jefferson P. Jones, Donald Pagach
Publisher:
Cengage Learning

Survey of Accounting (Accounting I)
Accounting
ISBN:
9781305961883
Author:
Carl Warren
Publisher:
Cengage Learning