Based on a sample of n = 26, the least-squares method was used to develop the prediction line Y, = 4 + 5X,. In addition, Syx = 1.8, X= 9, and (X -X)2 = 26, Complete parts (a) and (b) below. i=1 Click here for page 1 of critical values of t. Click here for page 2 of critical values of t. a. Construct a 95% confidence interval estimate of the population mean response for X = 5. 26.0036 sHyx = 5s 31.9964 (Round to four decimal places as needed.)
Based on a sample of n = 26, the least-squares method was used to develop the prediction line Y, = 4 + 5X,. In addition, Syx = 1.8, X= 9, and (X -X)2 = 26, Complete parts (a) and (b) below. i=1 Click here for page 1 of critical values of t. Click here for page 2 of critical values of t. a. Construct a 95% confidence interval estimate of the population mean response for X = 5. 26.0036 sHyx = 5s 31.9964 (Round to four decimal places as needed.)

Linear Algebra: A Modern Introduction
4th Edition
ISBN:9781285463247
Author:David Poole
Publisher:David Poole
Chapter7: Distance And Approximation
Section7.3: Least Squares Approximation
Problem 31EQ

Related questions
Question
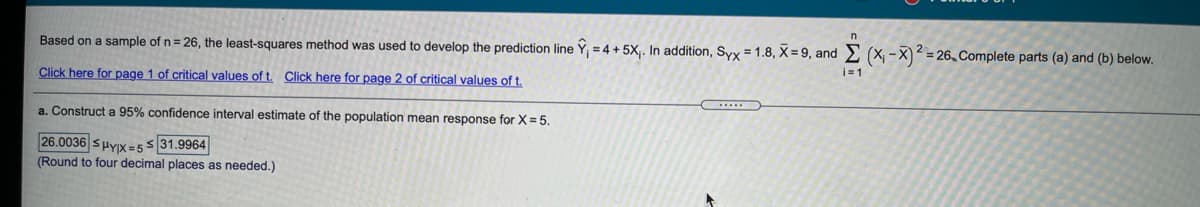
Transcribed Image Text:Based on a sample of n = 26, the least-squares method was used to develop the prediction line Y, = 4 + 5X,. In addition, Syx = 1.8, X= 9, and E (X, -X)2 = 26, Complete parts (a) and (b) below.
i=1
Click here for page 1 of critical values of t. Click here for page 2 of critical values of t.
a. Construct a 95% confidence interval estimate of the population mean response for X = 5.
26.0036 sHyx = 5s 31.9964
(Round to four decimal places as needed.)
Expert Solution
This question has been solved!
Explore an expertly crafted, step-by-step solution for a thorough understanding of key concepts.

This is a popular solution!

Trending now
This is a popular solution!

Step by step
Solved in 2 steps with 2 images

Recommended textbooks for you
Linear Algebra: A Modern Introduction
Algebra
ISBN:
9781285463247
Author:
David Poole
Publisher:
Cengage Learning
Linear Algebra: A Modern Introduction
Algebra
ISBN:
9781285463247
Author:
David Poole
Publisher:
Cengage Learning